Can AI warn of severe storms before radar sees them?
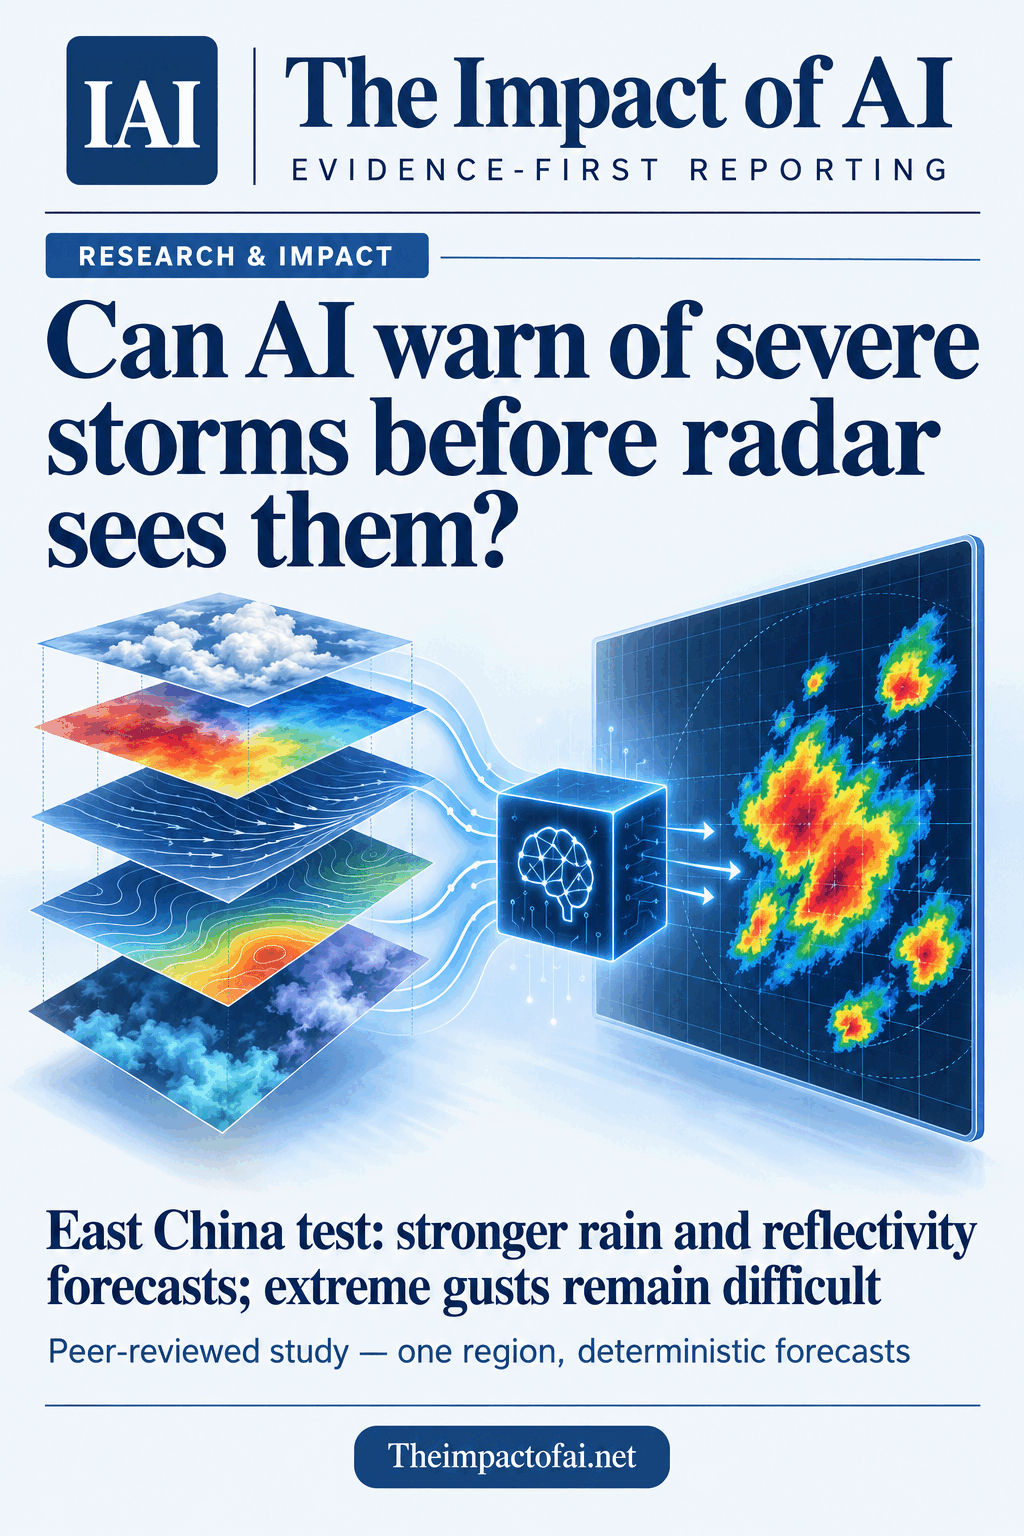
A peer-reviewed East China study combined radar, weather stations and three-dimensional atmospheric forecasts to predict severe convection up to 12 hours ahead. The model improved many rain and reflectivity scores, but extreme gusts, regional transfer and operational warning benefits remain unproven.
Editorial responsibility: The Impact of AI Editorial Desk · Report a factual concern
Research topic
Environment-conditioned deep learning for severe-convection nowcasting in East China
At a glance
- 1FuXi-Nowcast combined radar, more than 1,300 weather stations and three-dimensional atmospheric forecasts to predict reflectivity, rainfall, wind gusts and surface conditions for up to 12 hours over East China.
- 2On an April-to-July 2024 benchmark, the model generally outperformed persistence, optical-flow extrapolation and the 3-kilometre CMA-MESO forecast for radar reflectivity and rainfall, especially at longer lead times.
- 3The evidence does not establish better public warnings or reduced harm: the test covered one region, extreme gust results were weak, the forecast was deterministic and a switch from reanalysis to operational atmospheric inputs degraded several high-impact scores.
The Impact Brief
Keep the evidence trail, not the noise.
Get the most consequential AI developments with direct sources and clear limits.
Living evidence record
Impact record IAI-01G1XOA
Evidence stage
Studied
Confidence
Corroborated
Reporting basis
Source analysis
Independent support
Present
Record status
Monitoring
Last checked
3 October 2026
Source trail
3 direct sources across 2 source types.
People impact
Documented in this record.
Uncertainty
Limits and next checks are explicit.
Stages describe the evidence available—not whether a technology is good or bad. See the public method.
Related-source reporting disclosure
This record analyses 3 linked source records around the same underlying development. The extra records add method, date or context, but they do not by themselves constitute independent replication of every performance claim or predicted outcome.
The model tries to see the environment before the echo
Weather radar is good at showing precipitation that already exists. The harder problem is convective initiation: identifying where warm, moist and unstable air will organise into a thunderstorm before a strong radar echo has appeared. Radar-extrapolation systems can move existing echoes forward, but they have little direct information about the three-dimensional atmosphere that creates or weakens them. Numerical weather prediction contains that environmental information, yet may blur the small, fast-growing structures that matter for a local warning.
FuXi-Nowcast was designed to bridge those approaches. The deep-learning system ingests recent radar and surface observations alongside a three-dimensional atmospheric forecast. It then predicts composite radar reflectivity, accumulated precipitation, surface wind gusts and other near-surface variables out to 12 hours. The central research question was not simply whether an AI could animate a radar image, but whether conditioning on the surrounding atmosphere could improve the initiation, evolution and decay of severe convection beyond radar-only extrapolation and an operational numerical model.[1][2]
What went into the East China test
The authors trained the system on warm-season data from April to September in 2019 through 2023. Training used ERA5 reanalysis for the large-scale atmospheric state, a Chinese radar composite for reflectivity, observations from more than 1,300 fixed ground stations, the high-resolution China Meteorological Administration Land Data Assimilation System and a land-sea mask. At inference time, the model used forecasts from FuXi-2.0 rather than future reanalysis, which is the more realistic operational arrangement.
The prediction domain covered approximately 29.01° to 36.68° north and 114.67° to 122.34° east. The authors represented it on a 768-by-768 grid at 0.01-degree spacing, roughly one kilometre. They evaluated forecasts initialised every three hours and verified them hourly from April through July 2024. Selected 2025 storms were presented as qualitative case studies, not folded into the quantitative benchmark. This distinction matters: vivid examples can show what a system can do, but the 2024 test period supplies the comparative evidence.
Training reportedly took about 24 hours for 30,000 iterations on two NVIDIA A100 graphics processors. Once trained, a 12-hour forecast took around ten seconds on one A100. That speed is operationally attractive, but computing time is not warning lead time. A warning service also needs reliable data arrival, quality control, forecaster review, dissemination and a decision threshold suited to local risk.[2]
The comparison mixed three different forecasting ideas
The researchers compared FuXi-Nowcast with persistence, which assumes the latest observed field continues; PySTEPS, an optical-flow system that extrapolates radar patterns; and CMA-MESO, the China Meteorological Administration's operational three-kilometre numerical forecast. These baselines represent a useful spread from simple continuity to radar-based motion and physics-based modelling. FuXi-Nowcast's advantage is therefore not measured against a single weak control.
The evaluation used the critical success index as its primary measure and also reported frequency bias, false-alarm ratio and probability of detection. For radar reflectivity and precipitation, the scoring allowed a five-by-five-kilometre neighbourhood around each one-kilometre grid cell. That reduces the double penalty caused when a forecast storm is close to, but not exactly on, the observed storm. It is a defensible verification choice, but readers should not interpret the scores as exact one-kilometre placement accuracy. Wind gusts were assessed at grids corresponding to stations.
One comparison is especially qualified. CMA-MESO did not provide a directly comparable gust product, so the researchers multiplied its ten-metre wind speed by 1.75. That engineered baseline is not the same as evaluating a native operational gust forecast. It makes the gust comparison less secure than the reflectivity and precipitation results and is one reason the paper should not be read as a complete operational bake-off.[2]
Reflectivity and rain improved most consistently
Across the 2024 benchmark, FuXi-Nowcast generally produced the highest critical success index for composite reflectivity, with a clearer advantage at medium and longer lead times. It led at the high 50-dBZ threshold throughout the tested horizon. That is relevant because intense reflectivity can be associated with hazardous convective cores, although a radar threshold alone does not identify every impact or prove that a warning should be issued.
The system also performed best for accumulated precipitation at the one-, 20- and 50-millimetre thresholds. The heavier thresholds remained difficult for every method, and their absolute critical success indices were low. In other words, the AI's relative lead does not turn rare, intense rainfall into a solved forecasting problem. A service deciding whether to act still needs calibrated probabilities, local vulnerability information and an understanding of the consequences of both missed events and false alarms.
The paper's process analysis is consistent with the proposed mechanism. In a selected 2025 dryline case, the environment-conditioned system generated convection that radar extrapolation could not create before an echo existed. That example supports plausibility, not generalisation: it was chosen for analysis after the main test period and does not provide an independent estimate of how often initiation will be correctly predicted.[2]
Extreme wind remains a hard boundary
Wind-gust results were less convincing. At the lower 10.8-metres-per-second threshold, FuXi-Nowcast became the strongest method after the first few forecast hours. At 13.9 and 17.2 metres per second, however, persistence and PySTEPS outperformed it. Those more extreme gusts are often the events of greatest concern for falling trees, power lines and vulnerable structures, so weakness at the upper thresholds is operationally important rather than a statistical footnote.
The model is deterministic: it produces one forecast, not a probability distribution or an ensemble that describes uncertainty. Convective forecasts are highly sensitive to small errors in temperature, humidity, wind and storm position. A deterministic display may look precise even when location errors are tens of kilometres. The authors acknowledge that the hourly time step can also miss rapid storm evolution. Warning agencies would need uncertainty information and locally validated decision rules before using such output as more than guidance.[2]
Operational atmospheric inputs exposed a source-shift problem
The training data used ERA5 reanalysis, a retrospectively assembled estimate of atmospheric conditions. Real-time operations cannot wait for that product, so inference used FuXi-2.0 forecasts. The authors explicitly tested the source shift. Some scores improved, but several high-impact, longer-lead results deteriorated sharply: relative reductions included 25.4% for 50-dBZ reflectivity at 12 hours, 24.4% for one-millimetre precipitation at 12 hours and 85.7% for 17.2-metres-per-second gusts at six hours.
Those percentages are relative changes in critical success index, not reductions in warning accuracy or public harm. They nevertheless reveal a common deployment risk: a model trained with cleaner retrospective inputs may behave differently when fed an operational forecast with its own biases. Further improvements will require training and testing on the actual data streams used in service, monitoring for source changes and reporting performance separately for rare extremes rather than relying on an average score.[2]
What this could mean for people in storm paths
If the results transfer into real forecasting practice, environment-conditioned AI could help meteorologists maintain useful guidance after radar-only extrapolation loses skill and recognise some storms before radar shows a mature echo. Earlier or more persistent situational awareness could support decisions about flash-flood preparation, outdoor events, transport, power networks and emergency staffing. A roughly ten-second model run also makes frequent updates technically plausible.
The study did not measure any of those downstream outcomes. It did not compare warning lead times, forecaster decisions, false public alerts, evacuation behaviour, service uptime, economic loss or injuries. The authors say the system has been deployed at the Jiangsu Meteorological Observatory, but deployment is not evidence of benefit. Forecast value depends on how trained professionals interpret the output and whether it improves decisions after accounting for false alarms, local exposure and communication constraints.
People should therefore treat this as promising forecasting research, not a claim that AI has made severe storms predictable. The immediate beneficiaries are most likely operational meteorologists receiving another source of guidance. The public benefit remains conditional on prospective evaluations that connect model output to better warnings and safer action.[1][2]
Access, geography and funding set limits on replication
The authors released source code through Zenodo, which helps technical scrutiny. The observational datasets themselves are not fully open: radar, station and other inputs remain available from their providers under licence or request conditions. Independent teams therefore may not be able to reproduce the full training and evaluation pipeline from the code archive alone. Reproducibility also depends on access to the operational FuXi-2.0 forecasts and the precise preprocessing used over time.
The benchmark covers one meteorological region in East China and one warm-season evaluation period. Climate regimes, radar networks, terrain, station density and operational practices differ substantially across South Asia, the Middle East, Africa, Europe and the Americas. The model would need local retraining or careful transfer tests, including sparse-observation settings, before performance elsewhere could be assumed.
The paper reports support from the AI for Science Program, the Shanghai Municipal Commission of Economy and Informatization and the National Natural Science Foundation of China under grant 42505143. The authors declared no competing interests. Those disclosures do not invalidate the work; they help readers understand who supported it and underline the value of independent, cross-region replication.[2][3]
What evidence would change the assessment
Confidence would rise with preregistered evaluations across multiple climate regimes and years, using operational inputs throughout and keeping a genuinely out-of-sample test set. Comparisons should include native probabilistic and gust products from strong operational systems, measure calibration as well as event detection, and publish uncertainty intervals. Results should be stratified by storm type, severity, lead time, region and data availability.
The decisive next step is a prospective operational trial. Forecast offices could compare standard practice with AI-assisted practice while measuring warning lead time, missed events, false alarms, forecaster workload, system failures and the quality of public decisions. Transparent incident reviews should document when atmospheric conditioning helps, when the model invents or misplaces convection and whether performance changes as upstream forecasts or observing systems are updated.
For now, the peer-reviewed evidence supports a bounded conclusion: combining atmospheric forecasts with high-resolution observations improved several severe-convection forecast scores over East China, particularly for reflectivity and rainfall at longer lead times. It does not yet show reliable prediction of the strongest gusts, transfer to other regions or safer outcomes for the public.[1][2][3]
What this means for people
- Meteorologists could gain fast, atmosphere-aware guidance beyond the short horizon of radar extrapolation, but they still need to judge uncertainty and local impacts.
- Emergency managers and infrastructure operators may eventually receive earlier notice, although the study did not measure any decision or safety benefit.
- People in storm paths should not treat a deterministic AI forecast as a warning on its own; official locally validated warning channels remain the relevant source for action.
Global context
Severe-convection nowcasting is a global public-safety problem, but observing systems and storm regimes vary widely. The East China results strengthen the case for combining physical environmental context with data-driven radar forecasting while also showing why regional validation, operational inputs and uncertainty estimates are essential before transfer to other countries.
What the evidence does not yet show
- The quantitative benchmark covered East China from April through July 2024; selected 2025 storms were qualitative case studies rather than part of the main test.
- Reflectivity and precipitation used five-by-five-kilometre neighbourhood verification, so scores should not be read as exact one-kilometre placement accuracy.
- The CMA-MESO gust baseline was derived by multiplying ten-metre wind speed by 1.75 rather than using a native gust product.
- The model was deterministic and hourly, with no probability distribution and limited ability to represent rapid storm evolution or location uncertainty.
- Training used ERA5 reanalysis while operations used FuXi-2.0 forecasts; that source shift degraded several longer-lead or extreme-event scores.
- The study did not evaluate warning decisions, public communication, economic effects, injuries or lives saved, and the core observational datasets are restricted by provider licences.
What to watch next
- Independent multi-region tests using local radar and station networks, especially in observation-sparse and topographically complex settings.
- Probabilistic or ensemble versions that quantify uncertainty and improve performance for the strongest gust and rainfall thresholds.
- Prospective trials measuring whether forecasters issue earlier, more accurate and more useful warnings with the system than without it.
- Operational monitoring for data-source drift, upstream forecast changes, missed initiation and false convective development.
Evidence trail
Sources used for this report
Links checked 3 October 2026
This report is labelled source analysis. We summarise and analyse source material in our own words; company statements remain attributed claims until independently supported. Translated summaries preserve the meaning of the original source and link back to it. Read our editorial standards.
Continue the story
Related reporting
Climate & Energy
Can satellite AI show where a town stays cooler?
A peer-reviewed Algeria case study compared four machine-learning methods on seven Landsat 9 scenes. The maps may help frame local heat questions, but the apparent accuracy comes from only 30 held-out proxy points—not field temperatures, human exposure or health outcomes.
9 min · 2 sources
Climate & Energy
Can AI forecast Chennai groundwater without a published sample count?
A peer-reviewed Indian study reports that a hybrid random-forest and LSTM model reduced test error to 0.38 metres across four Chennai-area locations. The chronological split is a strength, but the paper does not state the number or frequency of observations behind the result.
9 min · 1 source
Climate & Energy
AI climate model maps regional heat and cyclone risks in new peer-reviewed study
GenFocal generated finer-scale weather scenarios from coarse climate simulations and beat two established statistical methods on several US tests. The journal paper is new today; its first preprint appeared in 2024.
4 min · 2 sources
Reader discussion
Add evidence, experience or a question
No account is required. Reader notes are published after a brief civility, relevance and safety check; disagreement is welcome.
Published reader notes
0No published reader notes yet. You can start the evidence-led discussion above.
Prefer a private correction or response? Contact the newsroom.