Can AI forecast Egypt’s groundwater decline?
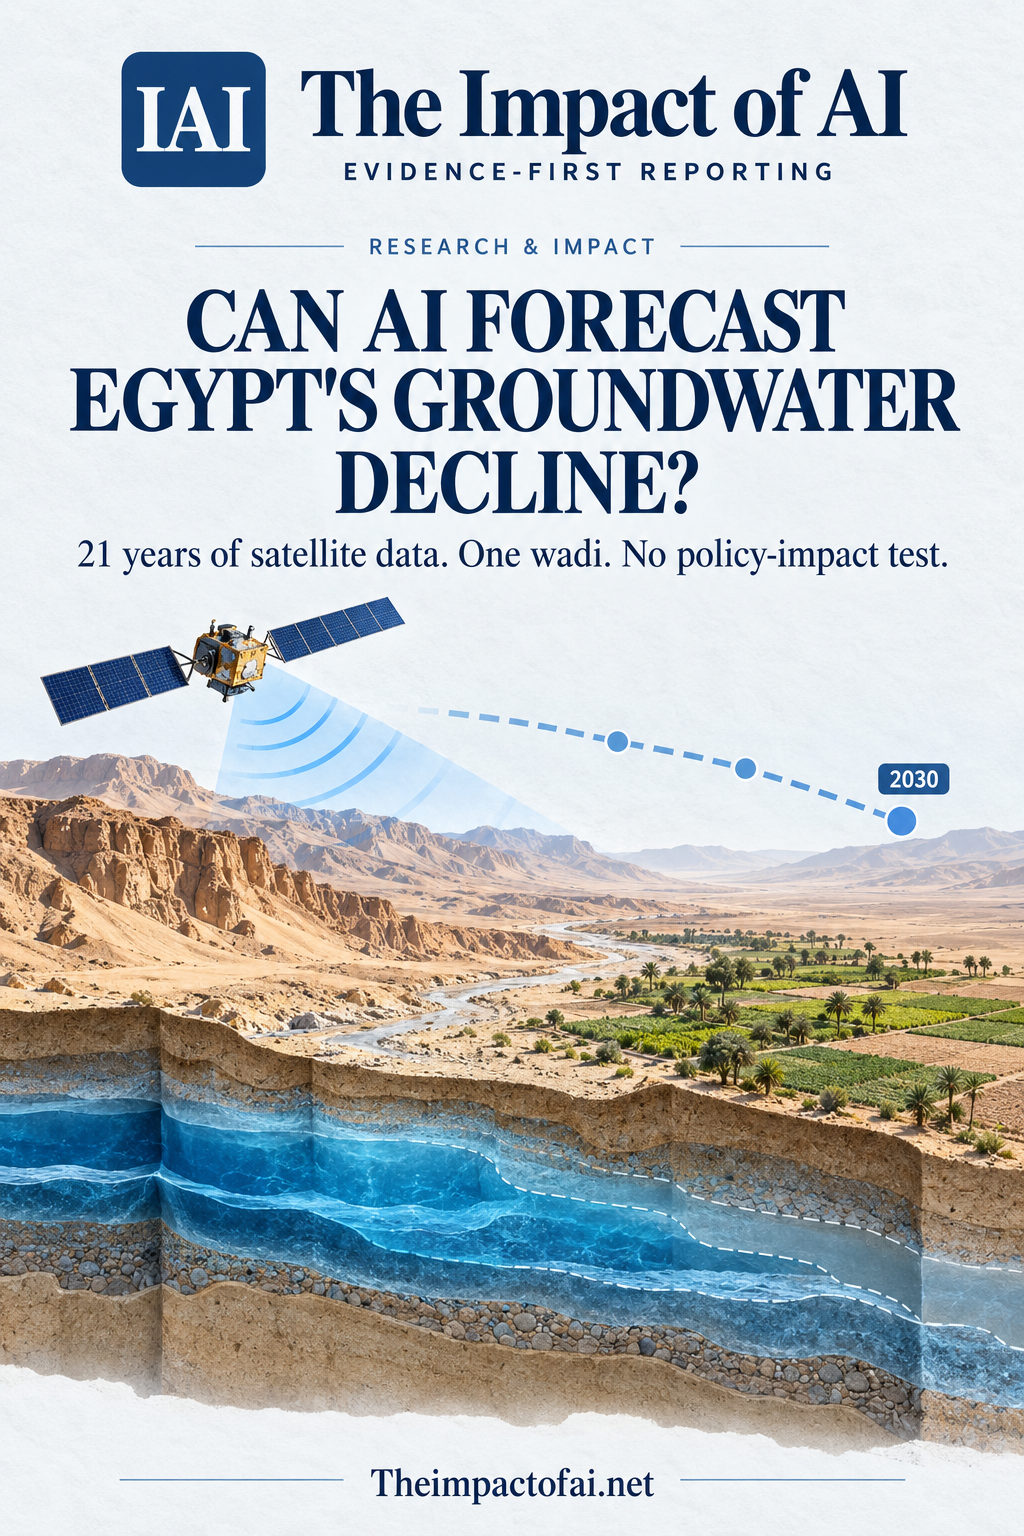
A peer-reviewed study combines 21 years of satellite water-storage estimates with land-use mapping and XGBoost for Wadi El-Assiuti. The held-out fit is strong, but the study area is smaller than one GRACE cell and the 2030 path assumes recent conditions continue.
Editorial responsibility: The Impact of AI Editorial Desk · Report a factual concern
Research topic
Whether satellite-derived groundwater storage, land-use mapping and an autoregressive XGBoost model can describe and forecast depletion in Wadi El-Assiuti
At a glance
- 1The study integrates monthly GRACE/GRACE-FO water-storage estimates, GLDAS soil moisture, CHIRPS rainfall and Landsat/Sentinel-2 land-use maps for 2003–2024 over a roughly 290-square-kilometre downstream study area.
- 2XGBoost was trained on January 2003–December 2016 and evaluated chronologically on January 2017–September 2024, reporting R² 0.924, RMSE 721,760 cubic metres and MAE 513,870 cubic metres.
- 3The study area is smaller than GRACE’s nominal footprint and effectively represented by one mascon cell. The 2025–2030 recursive forecast adds no independent rainfall, climate, pumping or land-use scenario, so it is a continuation of recent system behaviour rather than a policy forecast.
The Impact Brief
Keep the evidence trail, not the noise.
Get the most consequential AI developments with direct sources and clear limits.
Living evidence record
Impact record IAI-0XKVY4B
Evidence stage
Studied
Confidence
Supported
Reporting basis
Source analysis
Independent support
Present
Record status
Monitoring
Last checked
5 October 2026
Source trail
1 direct source across 1 source type.
People impact
Documented in this record.
Uncertainty
Limits and next checks are explicit.
Stages describe the evidence available—not whether a technology is good or bad. See the public method.
Single-source reporting disclosure
This record analyses one direct source. It can establish what Scientific Reports published or reported, but it is not independent corroboration of every performance claim or predicted outcome. The confidence label will change only when broader evidence is added.
The evidence starts with a regional satellite signal
Groundwater supports farms and communities across arid regions, yet direct monitoring is often sparse. Mohammed Hagage of Egypt’s National Authority for Remote Sensing and Space Sciences assembled a 2003–2024 record for the downstream part of Wadi El-Assiuti in the Eastern Desert. The paper combines satellite gravity measurements, a land-surface model, rainfall estimates and classified satellite imagery, then adds an XGBoost forecast through 2030.
The downstream study domain covers about 290 square kilometres within a much larger wadi catchment. Monthly terrestrial water-storage anomalies came from the GRACE and GRACE Follow-On satellite missions. Soil moisture came from the GLDAS-2.2 Noah model, precipitation from CHIRPS, and agricultural land was mapped from Landsat and Sentinel-2 imagery. In this hyper-arid setting, the analysis treats snow, persistent surface water and canopy storage as negligible and uses the remaining water-balance components to estimate groundwater-storage anomalies.
That construction is useful where wells are scarce, but its spatial scale is the first major caution. The paper says the study area is smaller than GRACE’s nominal resolution and is effectively represented by a single mascon cell. The extracted series should therefore be read as regional storage change, not a local measurement of a particular well, farm or aquifer pocket. Published piezometric observations from 1997–2019 provide only discontinuous snapshots for comparison rather than a continuous ground-truth network.[1]
Twenty-one years show depletion alongside agricultural expansion
The study reports a cumulative groundwater-storage deficit of about 11.1 million cubic metres by 2024 relative to its 2003 baseline. A Mann–Kendall test found a significant downward trend in the estimated groundwater anomaly, with an average cumulative loss of about 987,000 cubic metres a year. The decline became more pronounced after 2012, although the record also contains short periods of recharge and a partial rebound after an unusually deep 2021–2022 drawdown.
Rainfall did not show a significant monotonic trend over the period, and its correlation with cumulative storage was weak. Irrigated agricultural area, by contrast, increased by a reported 273% and had a strong negative correlation with cumulative storage, r = −0.76 with p below 0.01. That pattern supports the interpretation that pumping associated with agricultural expansion is the dominant pressure in this record.
Correlation is not a controlled attribution experiment. Agricultural area is a proxy for abstraction rather than a meter reading of water pumped, and the paper does not model every possible influence such as lateral groundwater flow, changes in crop mix, irrigation efficiency, unrecorded wells or errors in the satellite products. The land-use classifier reached about 92% overall accuracy, but classification error and the shift from 30-metre Landsat to 10-metre Sentinel-2 imagery can still affect a long-run comparison. The finding is consequential evidence of association, not proof that each added field caused a quantified volume of depletion.[1]
The machine-learning test respects time order
For forecasting, the author trained XGBoost on monthly observations from January 2003 through December 2016 and evaluated it on the later period from January 2017 through September 2024. That chronological split is stronger than randomly mixing months because future observations never enter the training set. Five-fold time-series cross-validation guided hyperparameter selection within the training period.
Inputs included current and lagged groundwater-storage measures, terrestrial water storage, monthly changes, a time index and sine-and-cosine encodings of the calendar month. On the 2017–2024 validation period, the model reported R² of 0.924, root-mean-square error of 721,760 cubic metres and mean absolute error of 513,870 cubic metres. The two largest misses occurred during the early-2022 anomaly, when one residual reached roughly −3.5 million cubic metres. This is an important reminder that the average result can conceal the extreme episode water managers may care about most.
The target is cumulative storage, a running sum with strong temporal persistence. Current-state water variables and the time index were among the most important predictors, so a model can obtain a high R² by learning the continuing trajectory of a smooth, autocorrelated series. The test demonstrates that XGBoost tracked later values derived from the same satellite-processing pipeline; it does not independently validate the absolute volume of water underground or show that the algorithm identified new causal mechanisms.[1]
The 2030 line is a continuation, not a scenario forecast
The 72-month projection from January 2025 through December 2030 is generated recursively, feeding earlier predicted states into later steps. It settles near a cumulative deficit of 12 million cubic metres, broadly extending the flatter behaviour seen in 2022–2024. The paper explicitly warns that this apparent plateau is not evidence of aquifer recovery or sustainable management.
No independent future precipitation, temperature, pumping, agricultural expansion or irrigation-efficiency scenario is supplied. The forecast therefore assumes the recent statistical behaviour continues. A new development programme, drought, flood-recharge event, crop shift or pumping rule could move the real trajectory away from the model quickly. Recursive prediction also compounds error because each estimated month becomes part of the information used for the next.
The model is best understood as a conditional baseline: if the system continues behaving like the historical record, this is the path its autoregressive structure produces. It cannot tell officials what will happen under a specific policy, nor compare the water saved by different interventions. Presenting the plateau without those assumptions would risk converting a technical extrapolation into false reassurance.[1]
What the work could change for people
For a data-scarce basin, an open satellite workflow can give water agencies a repeatable warning signal between field surveys. It could help identify when regional storage departs from a recent baseline and where scarce monitoring resources deserve attention. Farmers and communities may benefit if better evidence leads to earlier planning, more efficient irrigation or fairer allocation during stress.
But the study measures none of those decisions or outcomes. No agency was assigned to use the forecast, no pumping rule changed, and no household, farm or ecosystem outcome was evaluated. A regional satellite signal also cannot decide which user should reduce consumption. Allocation choices involve livelihoods, food production, legal rights, affordability and distributional fairness as well as hydrology.
Operational use should therefore pair the model with denser well measurements, abstraction records and accountable local governance. Alerts need uncertainty ranges and thresholds that reflect the cost of missed rapid decline versus false alarms. The current paper provides a monitoring and modelling foundation, not evidence that an AI system has managed groundwater or prevented scarcity.[1]
What would strengthen or overturn the assessment
Confidence would rise with a continuous, independently audited network of observation wells across the wadi; direct pumping records; uncertainty propagation from GRACE, GLDAS and land-use classification; and a locked forecast tested on observations collected after publication. Comparisons with simple baselines such as persistence, a linear trend and seasonal statistical models would show how much value XGBoost actually adds.
Scenario tests should vary agricultural expansion, irrigation efficiency, rainfall and recharge rather than hold forcing implicitly constant. A spatial model using additional remote-sensing and hydrogeological evidence could examine whether basin-scale changes are distributed unevenly. Most importantly, a prospective study should ask whether agencies using the forecast make better, fairer and more timely decisions than agencies relying on existing practice.
The paper reports no specific funding and no competing financial interests. Its strongest conclusion is the historical one: multiple open datasets point to sustained regional groundwater depletion associated with agricultural expansion. The 2030 forecast is useful as a transparent continuation of that record, but it remains conditional on one coarse regional signal and an assumption that the recent system persists.[1]
What this means for people
- Water agencies may gain a reproducible regional warning signal where wells are sparse, but it cannot identify conditions at an individual farm or borehole.
- Farmers and communities could be affected by decisions based on the forecast, making uncertainty, local measurement and transparent allocation rules essential.
- The study does not show that AI reduced pumping, protected access or improved livelihoods; those effects require prospective evaluation.
Global context
The work is rooted in Egypt’s Eastern Desert and is particularly relevant to arid basins across the Middle East and North Africa. GRACE, GLDAS, CHIRPS and Landsat/Sentinel data are globally available, so the workflow is reproducible in principle. Transfer is not automatic: aquifer geology, cell size, recharge, pumping records, crops and governance differ by basin, and every region needs local ground validation before a satellite-trained forecast informs allocation.
What the evidence does not yet show
- The roughly 290-square-kilometre study area is smaller than GRACE’s nominal footprint and is effectively represented by one mascon cell.
- The only in-situ comparison consists of discontinuous published piezometric snapshots from 1997–2019 rather than a continuous validation network.
- Agricultural area is used as a proxy for groundwater abstraction; direct pumping volumes and causal policy tests were not available.
- The cumulative target is highly autocorrelated, and current-state storage variables plus a time trend dominate the model.
- The recursive 2025–2030 forecast contains no independent future rainfall, climate, land-use or pumping scenario and can accumulate error.
- No water-management decision, access, livelihood, public-health or ecological outcome was measured.
What to watch next
- Post-publication validation against new satellite months and continuous well observations.
- Direct abstraction records and scenario forecasts for agricultural expansion, irrigation efficiency and recharge.
- Head-to-head comparison with persistence, seasonal and linear-trend baselines, including uncertainty intervals.
- Prospective evidence that decision-makers act differently and improve water outcomes without unfairly shifting costs.
Evidence trail
Sources used for this report
Links checked 5 October 2026
This report is labelled source analysis. We summarise and analyse source material in our own words; company statements remain attributed claims until independently supported. Translated summaries preserve the meaning of the original source and link back to it. Read our editorial standards.
Continue the story
Related reporting
Climate & Energy
Can AI forecast Chennai groundwater without a published sample count?
A peer-reviewed Indian study reports that a hybrid random-forest and LSTM model reduced test error to 0.38 metres across four Chennai-area locations. The chronological split is a strength, but the paper does not state the number or frequency of observations behind the result.
10 min · 1 source
Climate & Energy
Can satellite AI show where a town stays cooler?
A peer-reviewed Algeria case study compared four machine-learning methods on seven Landsat 9 scenes. The maps may help frame local heat questions, but the apparent accuracy comes from only 30 held-out proxy points—not field temperatures, human exposure or health outcomes.
10 min · 2 sources
Climate & Energy
Can satellite AI travel across regions?
A peer-reviewed Egyptian benchmark found that five change-detection models lost accuracy when moved between Chinese and French remote-sensing datasets. Aligning feature statistics and adding ten labelled target examples recovered part of the gap, but the study covers three public benchmarks—not live disaster or climate operations.
7 min · 3 sources
Reader commentary
Add evidence, experience or a question
No account is required. Reader notes are published after a brief civility, relevance and safety check; disagreement is welcome.
Explore commentary across the portal →Published reader notes
0No published reader notes yet. You can start the evidence-led discussion above.
Prefer a private correction or response? Contact the newsroom.