Can a hybrid model forecast clean energy further?
D-MambaFormer produced the lowest average error on three energy-related benchmarks while using a compact hybrid architecture. The improvements over the strongest alternatives were roughly 0.3% to 3%, and no live grid, dispatch decision or operating cost was tested.
Editorial responsibility: The Impact of AI Editorial Desk · Report a factual concern
Research topic
Whether a hybrid state-space and attention architecture improves long-horizon forecasting accuracy and computational efficiency across solar, weather and electricity-load benchmarks
At a glance
- 1The evaluation used 52,696 ten-minute weather observations with 21 variables, 8,760 hourly solar observations with seven variables, and 26,304 hourly observations for 321 electricity-load series.
- 2Average mean-squared error was 0.221 on Weather, 0.575 on Solar and 0.158 on Electricity—about 3%, 0.3% and 2% lower than the strongest reported comparator for each dataset.
- 3The paper used chronological 70:10:20 splits, reproduced baselines in one environment and checked three seeds, but did not test a live grid, independent operator, forecast-to-decision workflow or economic outcome.
The Impact Brief
Keep the evidence trail, not the noise.
Get the most consequential AI developments with direct sources and clear limits.
Living evidence record
Impact record IAI-1EHQ0NH
Evidence stage
Studied
Confidence
Supported
Reporting basis
Source analysis
Independent support
Present
Record status
Monitoring
Last checked
4 October 2026
Source trail
1 direct source across 1 source type.
People impact
Documented in this record.
Uncertainty
Limits and next checks are explicit.
Stages describe the evidence available—not whether a technology is good or bad. See the public method.
Single-source reporting disclosure
This record analyses one direct source. It can establish what Scientific Reports published or reported, but it is not independent corroboration of every performance claim or predicted outcome. The confidence label will change only when broader evidence is added.
The model combines two different ways of remembering time
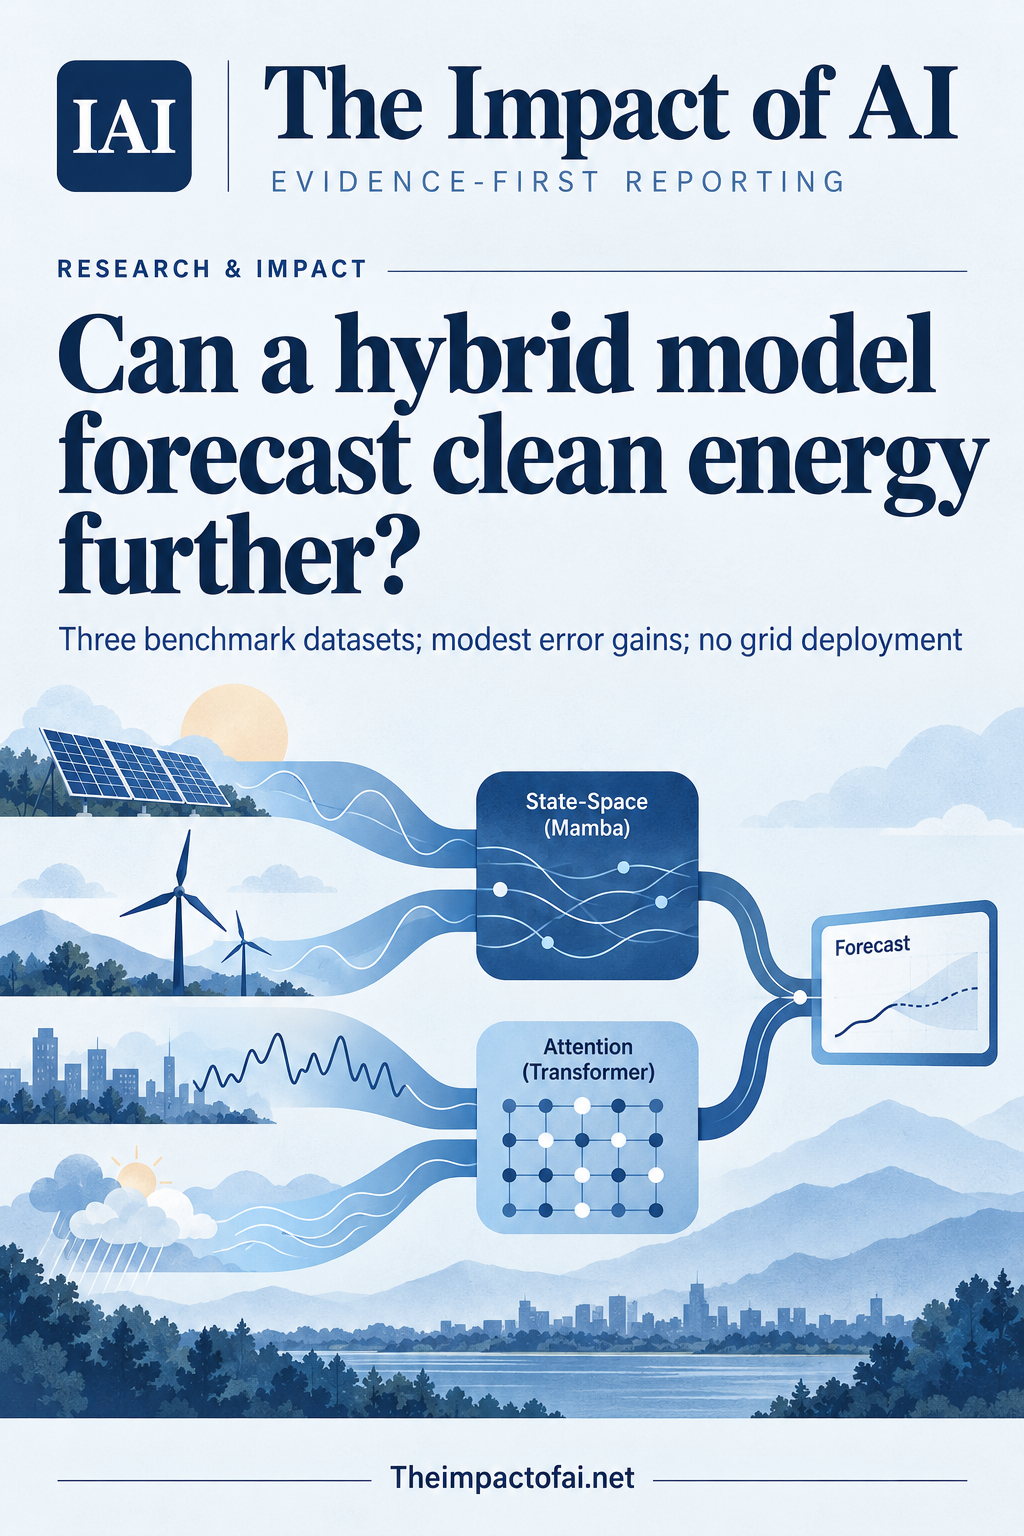
Energy forecasts have to preserve fast local changes without losing slower patterns across a long input sequence. The new D-MambaFormer model gives those jobs to two branches. A Transformer-style attention encoder represents short- and medium-range relationships, while a Mamba state-space encoder carries information across longer spans with computational cost that grows roughly linearly rather than quadratically with sequence length. Their features are concatenated before the final forecast.
Before either branch, the model divides each multivariate sequence into overlapping patches and applies what the authors call a Mixture of Patch Extractors. The aim is to let the network choose among several local representations rather than treating every window with one fixed extractor. This is an architecture paper: its main question is whether the combination reduces benchmark error and compute demands, not whether it changes how a particular grid is run.
That distinction is important because the word energy covers several different targets. The three tests represent German weather measurements, Chinese solar irradiance and weather variables, and European household or customer electricity-load series. They do not represent one integrated grid-control problem, and the model was not connected to dispatch, storage, trading, maintenance or curtailment decisions.[1]
Three datasets test different scales, not three independent deployments
The Weather benchmark contains 52,696 observations sampled every ten minutes from January 2020 to January 2021, with 21 variables including temperature and humidity. The Solar dataset contains 8,760 hourly observations from calendar year 2014 and seven variables: global, direct and diffuse irradiance, atmospheric pressure, relative humidity, wind speed and wind direction. The Electricity dataset contains 26,304 hourly observations from July 2016 to July 2019 for 321 load series.
Every dataset was divided chronologically: 70% for training, 10% for validation and 20% for testing. That is more appropriate than a random row split for a forecasting task because the test period comes after the data used to fit and tune the model. Candidate input lengths of 96, 192, 336, 512 and 720 time steps were selected through validation performance, and the locked configuration was then evaluated at forecast horizons of 96, 192, 336 and 720 steps.
The denominator nevertheless needs care. A 720-step horizon means five days on the ten-minute Weather series but 30 days on the hourly Solar and Electricity series. The same horizon label therefore represents different real durations. The benchmarks also come from one historical period each. They cannot show how the method handles new solar hardware, changed demand behaviour, extreme weather outside the training distribution or a shift in measurement quality.[1]
The accuracy gains are consistent but small
The authors reproduced four Transformer baselines—PatchTST, Preformer, FEDformer and Autoformer—alongside TimesNet, MICN-regre, DLinear and three recent state-space approaches, S-Mamba, DPEM and SST. The models used the same data partitions and hardware environment, while architecture-specific settings followed official implementations or recommendations. Mean-squared error was the main measure and mean absolute error was also reported.
With its input length selected from the candidate set, D-MambaFormer recorded an average mean-squared error of 0.221 on Weather, compared with 0.228 for the strongest baseline, PatchTST: an improvement of about 3%. On Solar it reached 0.575 against 0.577 for DPEM, roughly 0.3%. On Electricity it reached 0.158 against 0.161 for DPEM, about 2%. Those results support the description competitive and sometimes best on these tables. They do not support claims of a step-change in forecast reliability.
Three random seeds—2020, 2021 and 2022—were used for the proposed model, with mean and standard deviation reported. Across additional horizons, mean-squared-error standard deviations were 0.001 to 0.007 on Weather, 0.002 to 0.010 on Solar and 0.001 to 0.003 on Electricity. Baselines were reported as three-seed means rather than with matching uncertainty intervals, and the paper did not provide a formal test of whether the small average gaps would persist across fresh data periods or sites.[1]
Ablations support the design, while efficiency has caveats
Removing components generally made the model worse in the Solar and Weather ablations. Across those tests, the patching step reduced mean-squared error by an average 32% and mean absolute error by 30% compared with the no-patching variant. The Mixture of Patch Extractors produced smaller average reductions of 7% and 6%. Transformer-only encoding performed better over short and medium horizons, while the Mamba-only branch did better at the longer horizons. Concatenating both feature sets outperformed scalar-weighted alternatives.
The compute experiments help explain the hybrid design. Compared with the Transformer encoder alone over six input lengths, the Mamba encoder used 59% less GPU memory on average, reduced training time by 61% and cut inference time by 30% on the Weather benchmark. In a full-model comparison with input length 512 and prediction horizon 336, D-MambaFormer used less peak memory than the listed alternatives on Weather and Solar, and a compact 2.974 million parameters on the high-dimensional Electricity data.
Those numbers are laboratory measurements on four NVIDIA Quadro RTX 6000 GPUs. The paper also states that reported floating-point operations exclude kernels the profiler does not capture, including Mamba's selective scan. S-Mamba, a pure state-space model, remained faster and lighter on several measures. Hardware efficiency in one training setup does not determine inference cost on an operator's servers, edge devices or cloud service, and no energy consumption or carbon footprint was measured.[1]
What remains unproven for grids and renewable operators
Forecast error matters because operators can use predictions when scheduling reserves, planning storage, buying power or managing variable renewable supply. But this study stops before those decisions. It does not compare the forecasts with a utility's existing production model, quantify avoided imbalance costs, test probabilistic uncertainty bands or simulate how a decision rule responds to an error. A lower average MSE can still conceal misses during the rare ramps or extreme conditions that matter most operationally.
Reproducibility is also uneven. The authors provide a public code repository, and the Weather and Electricity data are linked to public sources. The Solar dataset is described as collected by State Power Investment Corporation in China, but the paper's data-availability statement provides no download link for it. Independent reproduction of that portion may therefore depend on access not documented in the paper.
A stronger next test would lock the architecture and hyperparameters, evaluate later periods and new geographic sites, and compare it against operator baselines without retuning on the test environment. It should report performance during extreme weather and rapid renewable ramps, produce calibrated prediction intervals, measure end-to-end latency and energy use, and connect forecast differences to costs, reliability and human decisions. A prospective shadow deployment could then show whether the modest benchmark gains survive real data quality and operational constraints.[1]
Funding, interests and the practical conclusion
The authors are affiliated with Zhengzhou University and SPIC Qinghai Photovoltaic Industry Innovation Center in China. The work was supported by China's National Natural Science Foundation, grant 52305559, and the China Postdoctoral Science Foundation, grant 2023M733208. The authors declared no known competing financial interests or personal relationships that could have influenced the work.
For energy data teams, D-MambaFormer is a credible research candidate: it combines complementary sequence models, is tested against recent alternatives and exposes code. For utilities and regulators, the conclusion should remain narrower. The study shows modest error reductions on three historical benchmarks under one experimental protocol. It does not yet show better grid reliability, cheaper power, lower emissions or safer operating decisions.[1]
What this means for people
- More accurate forecasts could eventually help operators schedule reserves and storage, but this paper does not measure effects on bills or reliability.
- Grid teams considering the architecture would still need local validation, uncertainty estimates and operational testing before using it for decisions.
- Researchers can inspect the released code and public Weather and Electricity data, while the Solar-data access gap limits full reproduction.
Global context
The study joins weather data from Germany, electricity-load data from a European benchmark and a Chinese solar dataset, while the research team is based in China. That breadth tests different data shapes, not universal transfer. Energy demand, generation mix, market rules, sensors and climate vary substantially, so local evaluation remains necessary before applying the architecture elsewhere.
What the evidence does not yet show
- The average error advantage over the strongest reported baseline was modest: approximately 3% on Weather, 0.3% on Solar and 2% on Electricity.
- Each benchmark covers one historical period, with no independent site, later-year holdout or prospective deployment.
- The baselines were reported as three-seed means without matching uncertainty intervals or a formal significance test for the small performance gaps.
- The Solar benchmark is described in detail, but the paper's data-availability statement does not provide a public download link for it.
- No probabilistic calibration, extreme-event analysis, operational decision, reliability outcome, financial effect or emissions impact was tested.
- Compute results come from one GPU setup, and the FLOP profiler excludes some operations including the selective-scan kernel.
What to watch next
- Independent reproduction of all three benchmarks, including documented access to the Solar data.
- Locked tests on later periods, new climates and different electricity systems without test-set retuning.
- Calibrated prediction intervals and results during rapid ramps, extreme weather and distribution shifts.
- A shadow deployment comparing end-to-end decisions, costs, reliability and energy use with existing operator forecasts.
Evidence trail
Sources used for this report
Links checked 4 October 2026
This report is labelled source analysis. We summarise and analyse source material in our own words; company statements remain attributed claims until independently supported. Translated summaries preserve the meaning of the original source and link back to it. Read our editorial standards.
Continue the story
Related reporting
Climate & Energy
Can satellite AI travel across regions?
A peer-reviewed Egyptian benchmark found that five change-detection models lost accuracy when moved between Chinese and French remote-sensing datasets. Aligning feature statistics and adding ten labelled target examples recovered part of the gap, but the study covers three public benchmarks—not live disaster or climate operations.
7 min · 3 sources
Climate & Energy
Can Japan's planned 400MW AI data centre grow without locking in gas?
JERA, Dell and RHAELM plan a more than $15 billion AI-computing site beside a Chiba power station. The 400MW figure describes intended capacity—not measured electricity use—and the announcement provides no emissions, water or efficiency forecast.
6 min · 3 sources
Climate & Energy
Met Office AI4Climate programme targets faster climate information
The UK Met Office's AI4Climate programme brings machine learning into climate modelling and services, with a focus on accelerating analysis while retaining physical understanding and scientific validation.
4 min · 1 source
Reader commentary
Add evidence, experience or a question
No account is required. Reader notes are published after a brief civility, relevance and safety check; disagreement is welcome.
Explore commentary across the portal →Published reader notes
0No published reader notes yet. You can start the evidence-led discussion above.
Prefer a private correction or response? Contact the newsroom.