A liver-cancer model ranked risk well—but the cancer rate was 0.062%
A nationwide South Korean study reported AUROC 0.945 in an unmatched validation cohort. Its precision-recall result was 0.0503, and the original probabilities needed recalibration before risk groups were interpretable.
The short version
3 key points
- What changed
- Researchers built the model from a final cohort of 7,961,075 South Korean adults without known viral hepatitis or prior liver cancer; 4,942 developed hepatocellular carcinoma during six years of follow-up.
- Why it matters
- People at elevated risk could receive more focused follow-up, but poor calibration or an unsuitable threshold could also generate anxiety, extra scans and avoidable procedures across a very large screened population.
- What to watch
- Independent validation outside South Korea, prospective calibration, subgroup performance, downstream test burden, cancers found at a treatable stage and evidence that model-guided screening improves outcomes rather than only risk ranking.
A huge cohort produced a strong ranking result, not a screening verdict
Researchers used South Korea's National Health Insurance Service screening data to develop a six-year hepatocellular-carcinoma risk model. From 14,607,170 screened adults aged 20 to 79, the final development population contained 7,961,075 people after exclusions for viral hepatitis, HIV, previous liver cancer and other criteria. There were 4,942 incident liver-cancer cases from 2018 to 2023. In an unmatched validation cohort that retained the real 0.062% cancer prevalence, the final deep neural network reached an area under the ROC curve of 0.9450 (95% confidence interval 0.9400 to 0.9510).[1]
The low base rate changes what the impressive AUROC means
AUROC measures how well a model ranks people who later develop cancer above those who do not across possible thresholds. It does not say how often a flagged person actually develops cancer. The precision-recall area was 0.0503—much higher than the 0.00062 baseline, but still modest in absolute terms. At the paper's 0.5 threshold, the positive predictive value was 15.29 times the population prevalence. After recalibration, the highest-risk quartile contained 597,080 people and 1,385 cancers, an observed six-year risk of 0.232%; the equally sized lowest quartile contained five cancers.[1]
Who it affects
People at elevated risk could receive more focused follow-up, but poor calibration or an unsuitable threshold could also generate anxiety, extra scans and avoidable procedures across a very large screened population.[1]
Keep in mind
Retrospective South Korean claims and screening data; rare outcome; probabilities required recalibration; no geographic or temporal external validation, prospective workflow trial, screening comparator or patient-outcome evidence.
Source analysis · 1 linked source. Original source date: 17 October 2026.
Continue the story
Read next
Health & Life Sciences
Can AI prioritise cognitive assessment in sleep apnoea?
A random-forest model separated concurrent mild cognitive impairment in an external Chinese cohort, but overestimated probabilities and was evaluated almost entirely in men. It is not a diagnostic or prognostic tool.
2 min · 1 source
Health & Life Sciences
Can a six-protein AI score rule out serious fatty liver disease?
A multicohort study reports AUCs of 0.79–0.83 for a six-protein MASH score and a 0.99 negative predictive value in a low-prevalence UK cohort. Different reference standards, small biopsy cohorts and unavailable routine assays keep it from clinical readiness.
3 min · 1 source
Read more The full report, methods and context
A huge cohort produced a strong ranking result, not a screening verdict
Researchers used South Korea's National Health Insurance Service screening data to develop a six-year hepatocellular-carcinoma risk model. From 14,607,170 screened adults aged 20 to 79, the final development population contained 7,961,075 people after exclusions for viral hepatitis, HIV, previous liver cancer and other criteria. There were 4,942 incident liver-cancer cases from 2018 to 2023. In an unmatched validation cohort that retained the real 0.062% cancer prevalence, the final deep neural network reached an area under the ROC curve of 0.9450 (95% confidence interval 0.9400 to 0.9510).[1]
The low base rate changes what the impressive AUROC means
AUROC measures how well a model ranks people who later develop cancer above those who do not across possible thresholds. It does not say how often a flagged person actually develops cancer. The precision-recall area was 0.0503—much higher than the 0.00062 baseline, but still modest in absolute terms. At the paper's 0.5 threshold, the positive predictive value was 15.29 times the population prevalence. After recalibration, the highest-risk quartile contained 597,080 people and 1,385 cancers, an observed six-year risk of 0.232%; the equally sized lowest quartile contained five cancers.
For patients and screening services, that distinction matters. A useful ranking tool might help decide who receives additional assessment, but even the highest group was dominated by people who did not develop cancer during follow-up. Benefits therefore depend on what test follows, how often it produces false alarms, whether earlier detection improves treatment, and whether extra surveillance displaces care elsewhere.[1]
The distinction that matters
Why ranking, precision and calibration answer different questions
The study reports three distinct properties of a rare-event prediction model.
Population
Follow 7,961,075 adults for six years
4,942 liver-cancer cases; prevalence 0.062%
Ranking
Compare model scores for cases and non-cases
AUROC 0.9450 in unmatched validation
Usefulness
Test precision and recalibrate absolute risk
AUPRC 0.0503; probabilities required correction
Calibration and external validation remain the safety test
The model's original probabilities substantially overestimated absolute risk, so the researchers recalibrated them before presenting four risk groups. Performance also fell in a separate non-selected cohort of 6,126,058 people, where AUROC was 0.8848 and AUPRC 0.0293. That is useful stress testing, but both cohorts came from the same national health system. The study used claims-based outcomes and routine screening variables rather than imaging, pathology, alpha-fetoprotein or detailed clinical records; baseline subclinical disease may also have influenced predictions.
The authors report Soonchunhyang University funding and no competing interests. The evidence supports population ranking within the studied Korean data, not a clinical recommendation or proof of prevented deaths. The assessment would change with temporal and international external validation, prospectively chosen thresholds, calibration reported by subgroup, and a controlled study showing that model-guided surveillance detects treatable cancers without disproportionate unnecessary testing.[1]
Watch the background, then check the evidence
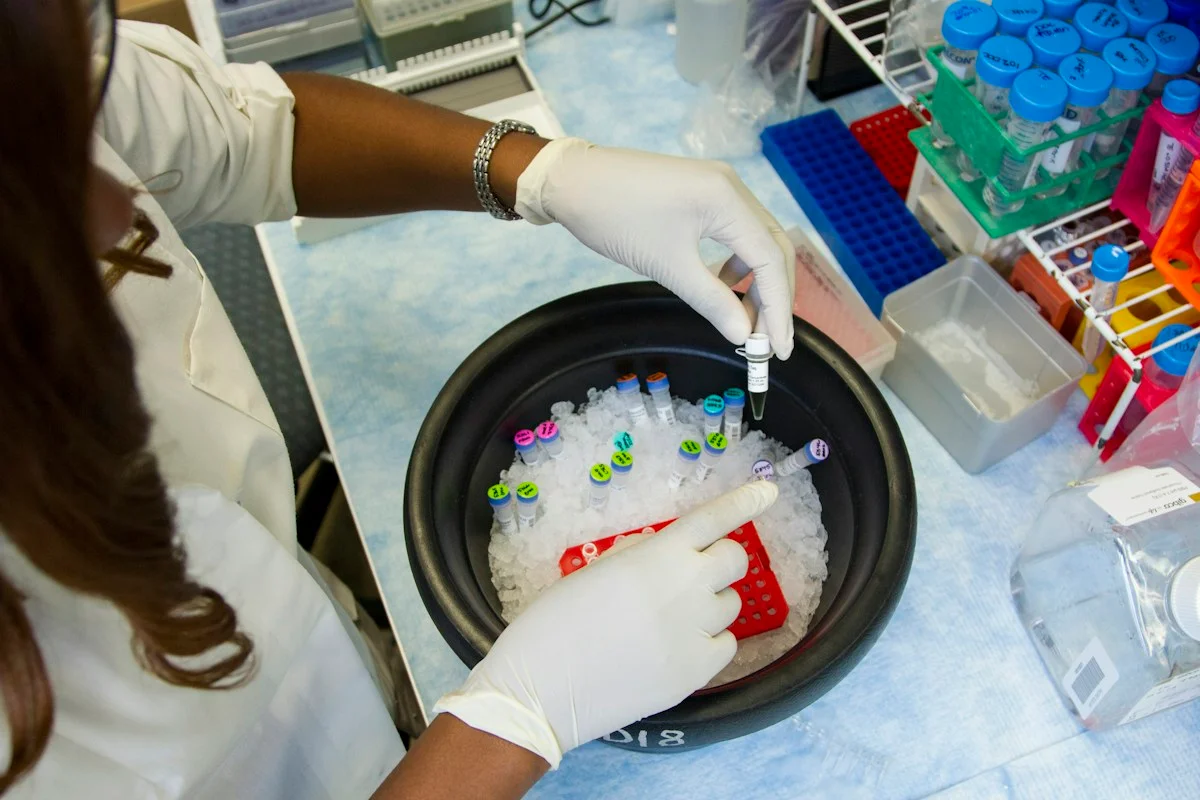
Illustrative photo · not a video frame
The Royal Society · 44 min 28 sec · Background explainer
Is this the AI future we want? | The Royal Society
YouTube loads only when you choose; playback starts when you press play.
A Royal Society discussion with Madhumita Murgia and biomedical engineer Alison Noble on AI’s potential in healthcare, science and culture, recorded at the 30 June 2026 event.
Evidence check: A discussion of opportunities and risks, including future possibilities. It is not evidence that every application described is available or clinically proven.
Published 2026-07-01. Source checked 14 October 2026. Check captions on the publisher’s video page.
Check the healthcare evidencePhoto: Daniel Sone / National Cancer Institute / Unsplash · Licence
Evidence check
Retrospective South Korean claims and screening data; rare outcome; probabilities required recalibration; no geographic or temporal external validation, prospective workflow trial, screening comparator or patient-outcome evidence.
Reporting basis: Source analysis. Original source date: 17 October 2026.
Explore the full source and evidence record
What this means for people
- People at elevated risk could receive more focused follow-up, but poor calibration or an unsuitable threshold could also generate anxiety, extra scans and avoidable procedures across a very large screened population.
Global context
The model was developed and validated inside South Korea's national insurance system. Liver-cancer causes, background prevalence, screening access and recorded variables differ across countries, so the reported probabilities cannot be transported without local validation and recalibration.
What the evidence does not yet show
- Retrospective South Korean claims and screening data; rare outcome; probabilities required recalibration; no geographic or temporal external validation, prospective workflow trial, screening comparator or patient-outcome evidence.
What to watch next
- Independent validation outside South Korea, prospective calibration, subgroup performance, downstream test burden, cancers found at a treatable stage and evidence that model-guided screening improves outcomes rather than only risk ranking.
Living evidence record
Impact record IAI-1X0YTOJ
Evidence stage
Studied
Confidence
Supported
Reporting basis
Source analysis
Independent or research support
Present
Record status
Monitoring
Last checked
17 October 2026
Source trail
1 direct source across 1 source type.
People impact
Documented in this record.
Uncertainty
Limits and next checks are explicit.
Stages describe the evidence available—not whether a technology is good or bad. See the public method.
Single-source reporting disclosure
This record analyses one direct source. It can establish what Scientific Reports published or reported, but it is not independent corroboration of every performance claim or predicted outcome. The confidence label will change only when broader evidence is added.
Evidence trail
Sources used for this report
Links checked 17 October 2026
Research question, topics and regions
Population risk stratification for hepatocellular carcinoma
Topics: Liver cancer · Screening · Risk prediction · Deep learning · Calibration
Regions: South Korea · Asia · Global
This report is labelled source analysis. We summarise and analyse source material in our own words; company statements remain attributed claims until independently supported. Translated summaries preserve the meaning of the original source and link back to it. Read our editorial standards.
The Impact Brief · Free
Keep following the stories that matter to you.
Get our weekday briefing on what changed and why it matters. Choose your topics below.
Reader commentary
What does this mean where you are?
Tell us what you have seen at work, in your community or in everyday life. A question is welcome too. No account is needed; we review notes before publishing them.
Explore commentary across the portal →Published reader notes
0No published reader notes yet. You can start the evidence-led discussion above.
Prefer a private correction or response? Contact the newsroom.