Four obesity profiles showed different muscle and spine risks—what did machine learning add?
A UK Biobank study used blood metabolites to derive four central-obesity subtypes associated with different rates of sarcopenia and intervertebral disc disease. The observational result is not a clinical test and does not show that the subtypes cause disease.
The short version
- What happened
- Researchers analysed 247,107 UK Biobank participants, including 84,733 with central obesity, over a median 13.8 years.
- Who it affects
- The work may eventually help distinguish people who share a waist measurement but have different metabolic risks. It should not yet change an individual's screening or treatment: the study did not test a clinical decision rule, intervention or patient benefit.
- What remains unproven
- Observational associations cannot establish that the metabolic subtypes caused later disease.
Keep in mind
Observational associations cannot establish that the metabolic subtypes caused later disease.
The UK Biobank cohort is predominantly of European ancestry, limiting geographic and ethnic generalisability.
Hospital and death records may miss milder or non-hospital cases, and the accessible report does not expose complete outcome event counts for each subtype.
The four-cluster silhouette score was 0.13, close to 0.14 for three clusters; stability and biological interpretation supported the authors' choice, but four groups were not uniquely compelled by separation alone.
The paper's prose is not fully consistent about whether the headline hazard ratios use the non-obese group or subtype I as comparator.
No prospective clinical validation, treatment comparison, screening performance or patient-outcome improvement was tested.
Source analysis · 1 linked source. Primary analysed source date: 2 November 2026.
Keep following the evidence
Join The Impact Brief founding list for selected AI reports, their effect on people and the evidence limits. Read a sample first.
Read the full report · 5 min The evidence, methods, implications and limitations

The finding is about risk groups, not a diagnostic AI
Machine learning helped researchers divide people with central obesity into four blood-metabolite patterns that were associated with different later risks of muscle loss and intervertebral disc disease. The study, published in Scientific Reports on 2 November, followed 247,107 UK Biobank participants for a median 13.8 years; 84,733 met the study's waist-circumference definition of central obesity. It does not show that the metabolic patterns cause disease, nor that clinicians should use the classification now.
The team began with 251 nuclear-magnetic-resonance plasma measures. A CatBoost model distinguished central obesity from non-obesity, reaching an area under the receiver-operating-characteristic curve of 0.80 in training and 0.772 in a held-out 30% validation set. SHAP rankings selected 13 metabolites. Principal-component analysis and K-means clustering then formed four subtypes within the central-obesity group, containing 21,184, 21,265, 12,276 and 30,008 participants. Bootstrap checks suggested that the four-cluster solution was stable, although its silhouette score was low and close to the three-cluster alternative.[1]
Two patterns were linked to later muscle and disc disease
One higher-risk pattern had low albumin and glutamine; another had higher glycoprotein acetyls, valine and several large-HDL measures. After adjustment for age, sex, deprivation, ethnicity, education, smoking, alcohol and blood pressure, the paper reports elevated hazards for sarcopenia and intervertebral disc disease in these groups. It gives headline hazard ratios of 1.43 for sarcopenia and 1.31 for intervertebral disc disease, with 95% confidence intervals of 1.28–1.61 and 1.19–1.45 respectively. It found no significant subtype differences for osteoporosis or rheumatoid arthritis.
The comparator needs care. The abstract describes the headline ratios against the non-obese group, while the results and discussion also say subtypes II and III had higher risk than subtype I. The public article text does not map each headline ratio cleanly to every subtype-comparator pair. This report therefore treats the numbers as the paper's summary associations, not as ready-to-use individual risk estimates.[1]
The distinction that matters
How the research moved from blood samples to risk associations
Each stage narrows the claim. The final result is an association in one cohort, not proof of clinical benefit.
Feature selection
CatBoost ranked 251 NMR measures
13 metabolites retained; validation AUC 0.772
Subtyping
PCA and K-means grouped 84,733 centrally obese participants
Four clusters; sizes 21,184 to 30,008
Follow-up
Cox models tracked four musculoskeletal diagnoses
Associations for sarcopenia and disc disease; not osteoporosis or rheumatoid arthritis
What would make the result clinically useful
For patients and clinicians, the immediate value is a research hypothesis: waist circumference may conceal biologically different groups. But the outcomes came from hospital and death records, so milder or non-hospital cases may be missed. UK Biobank participants are predominantly of European ancestry, residual confounding remains possible, and a single baseline metabolic profile cannot show how risk changes over time. The study also did not compare treatment decisions, screening accuracy, quality of life or patient outcomes with and without the subtype system.
A stronger assessment would require external validation in more diverse cohorts, prespecified thresholds, complete event counts and calibration, and a prospective test showing that subtype-guided care improves outcomes without unnecessary testing or treatment. The paper was funded by the Wuhan Nursing Society Scientific Project; the authors declared no conflict of interest. Until intervention evidence exists, the responsible conclusion is that machine-learning-assisted metabolomics found reproducible-looking risk groups in one cohort—not that it delivered a clinical AI for preventing muscle or spine disease.[1]
Watch the background, then check the evidence
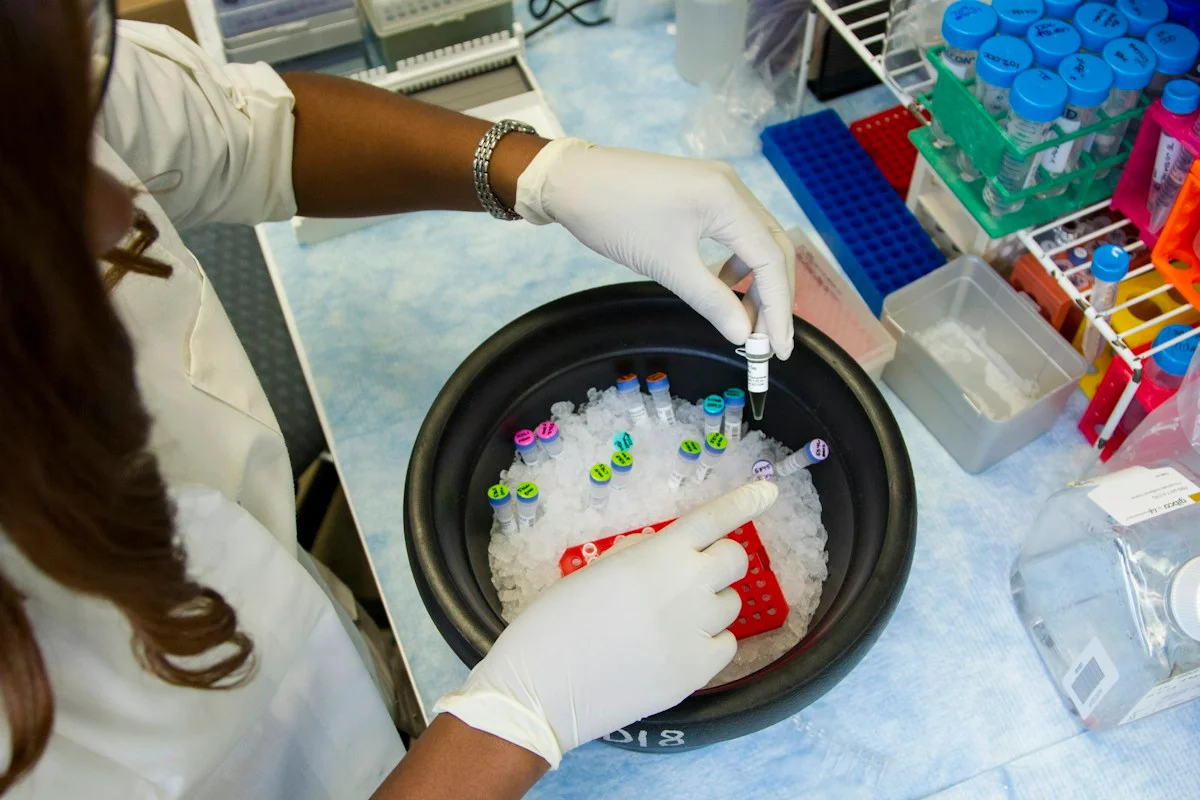
Illustrative photo · not a video frame
The Royal Society · 44 min 28 sec · Background explainer
Is this the AI future we want? | The Royal Society
YouTube loads only when you choose; playback starts when you press play.
A Royal Society discussion with Madhumita Murgia and biomedical engineer Alison Noble on AI’s potential in healthcare, science and culture, recorded at the 30 June 2026 event.
Evidence check: A discussion of opportunities and risks, including future possibilities. It is not evidence that every application described is available or clinically proven.
Published 2026-07-01. Source checked 14 October 2026. Check captions on the publisher’s video page.
Check the healthcare evidencePhoto: Daniel Sone / National Cancer Institute / Unsplash · Licence
Continue the story
Read next
Continue exploring risk prediction: compare the finding and its evidence limits.
An early diabetes model separated 78 test cases—but fasting glucose carried most of the signal
The single-hospital study balanced 130 gestational-diabetes cases with 130 controls. Its AUC was 0.865, yet calibration was imperfect and the multi-indicator model added little beyond fasting glucose.
Read the next reportExplore the full source and evidence record
What this means for people
- The work may eventually help distinguish people who share a waist measurement but have different metabolic risks. It should not yet change an individual's screening or treatment: the study did not test a clinical decision rule, intervention or patient benefit.
Global context
The cohort covers England, Scotland and Wales, while the research team is based in China. Blood-metabolite distributions, healthcare coding, obesity prevalence and musculoskeletal risk differ across populations, so independent validation is needed before the subtypes can travel to other health systems.
What the evidence does not yet show
- Observational associations cannot establish that the metabolic subtypes caused later disease.
- The UK Biobank cohort is predominantly of European ancestry, limiting geographic and ethnic generalisability.
- Hospital and death records may miss milder or non-hospital cases, and the accessible report does not expose complete outcome event counts for each subtype.
- The four-cluster silhouette score was 0.13, close to 0.14 for three clusters; stability and biological interpretation supported the authors' choice, but four groups were not uniquely compelled by separation alone.
- The paper's prose is not fully consistent about whether the headline hazard ratios use the non-obese group or subtype I as comparator.
- No prospective clinical validation, treatment comparison, screening performance or patient-outcome improvement was tested.
What to watch next
- External validation in ethnically and geographically diverse cohorts
- Complete subtype-specific event counts, calibration and absolute risk
- Repeated metabolite measurements to test whether subtype changes matter
- Prospective comparison of subtype-guided care with standard assessment
- Evidence that any intervention improves function, pain or quality of life
Living evidence record
Impact record IAI-0NOF6H0
Evidence stage
Studied
Confidence
Supported
Reporting basis
Source analysis
Independent or research support
Present
Record status
Monitoring
Last checked
2 November 2026
Source trail
1 direct source across 1 source type.
People impact
Documented in this record.
Uncertainty
Limits and next checks are explicit.
Stages describe the evidence available—not whether a technology is good or bad. See the public method.
Single-source reporting disclosure
This record analyses one direct source. It can establish what Scientific Reports published or reported, but it is not independent corroboration of every performance claim or predicted outcome. The confidence label will change only when broader evidence is added.
Evidence trail
Sources used for this report
Links checked 2 November 2026
Research question, topics and regions
Machine-learning-assisted metabolic subtyping and musculoskeletal risk
Topics: Machine learning · Metabolomics · Obesity · Sarcopenia · Musculoskeletal health · Risk prediction
Regions: Europe · United Kingdom · China
This report is labelled source analysis. We summarise and analyse source material in our own words; company statements remain attributed claims until independently supported. Translated summaries preserve the meaning of the original source and link back to it. Read our editorial standards.
Reader commentary
What does this mean where you are?
Tell us what you have seen at work, in your community or in everyday life. A question is welcome too. No account is needed; we review notes before publishing them.
Explore commentary across the portal →Published reader notes
0No published reader notes yet. You can start the evidence-led discussion above.
Prefer a private correction or response? Contact the newsroom.