Can a pediatric ICU mortality model be useful if it misses most deaths?
A peer-reviewed analysis of 4,272 children found an apparently strong AUC of 0.8521, yet the selected model detected only 42% of the children who died. The result is a warning about what one hospital database cannot support—not a clinical tool ready for use.
The short version
- What happened
- The retrospective study retained 4,272 children from one Chinese hospital database: 4,056 survived and 216 died, for an in-hospital mortality rate of 5.06%.
- Who it affects
- No child was treated on the basis of this model. The main near-term consequence is how researchers and clinicians interpret a strong AUC beside a low detection rate for deaths.
- What remains unproven
- Retrospective analysis of one hospital’s 2010–2018 database, with no external or temporal validation.
Keep in mind
Retrospective analysis of one hospital’s 2010–2018 database, with no external or temporal validation.
Only 216 deaths were available, and the hold-out test therefore contained a much smaller number of outcome events.
The usable predictors were dominated by laboratory measures and omitted important physiological and neurological information.
Missing values were imputed, variables over 60% missing were excluded, and performance may depend on those preprocessing choices.
No head-to-head comparison with established pediatric risk scores, calibration assessment, decision-curve analysis or prospective clinical evaluation was reported.
Source analysis · 2 linked sources. Primary analysed source date: 2 November 2026. Earliest linked supporting source: 1 January 2026.
Keep following the evidence
Join The Impact Brief founding list for selected AI reports, their effect on people and the evidence limits. Read a sample first.
Read the full report · 9 min The evidence, methods, implications and limitations
The answer is no—not as a clinical warning system on this evidence
A model can look good on a headline discrimination score and still fail the job that matters at the bedside. In a peer-reviewed analysis of a public pediatric intensive-care database, the best model produced an area under the receiver-operating-characteristic curve, or AUC, of 0.8521. Yet at the decision threshold chosen by the researchers, its sensitivity was 42%. In practical terms, the positive classification identified fewer than half of the children who died. The study therefore supports a narrower and more useful conclusion: the database contains mortality-related signal, but it does not contain a sufficiently complete picture for a reliable clinical alert.
The researchers were not testing a deployed product. They used de-identified records from the Pediatric Intensive Care database, drawn from Children’s Hospital of Zhejiang University School of Medicine between 2010 and 2018. The database contains 13,499 admissions from 12,881 patients aged up to 18 years. For this analysis, the team excluded neonates, kept only the first admission for each patient and used information recorded during the first 24 hours of intensive care. Those choices aimed to reduce repeated-patient bias and prevent later disease progression from leaking into an early-risk prediction.[1]
Who was included and what the model could see
After applying the eligibility rules, the final cohort contained 4,272 children aged one month to 17 years. Of them, 4,056 survived and 216 died during the intensive-care stay, a mortality rate of 5.06%. The team selected 49 predictors after a literature review, clinical consultation and data-quality screening: 45 laboratory variables, three vital signs and one demographic variable. Minimum, mean or maximum summaries expanded these into 100 derived features. Variables missing for more than 60% of patients were excluded; remaining gaps were filled with a multiple-imputation method based on LightGBM.
That feature balance matters. A pediatric ICU assessment normally draws on neurological state, respiratory support, circulation, diagnoses, treatment and change over time. This dataset’s usable signal was concentrated in laboratory measurements. The authors say essential physiological and neurological information was absent or too incomplete. A sophisticated algorithm cannot recover a variable that was never recorded. Imputation can estimate missing values from relationships in observed data, but it cannot turn a sparse, single-centre record into a representative view of every critically ill child.[1]
The distinction that matters
Why the same model can look strong and still miss danger
The study measured ranking performance and one operating threshold, but it did not test clinical use.
Dataset
4,272 children from one hospital
216 deaths; 49 retained predictors, mostly laboratory variables
Model
Train on 3,417 and test on 855
Optimized CatBoost AUC 0.8521
Threshold
Classify higher-risk children
42% sensitivity; most deaths were not positively classified
Not tested
Clinician receives an alert
No external validation, workflow trial or patient-outcome evidence
How the test was run
The researchers split the 4,272 records into 80% for training and 20% for a final hold-out test, preserving the proportion of deaths in each subset. The training set contained 3,417 patients and the test set 855. Within training, five-fold stratified cross-validation was used to compare nine machine-learning classifiers. The model with the highest cross-validated AUC—CatBoost—was then tuned through Bayesian optimization. The classification threshold was selected within the training data to maximize the F1 score before the model was evaluated once on the hold-out set.
The design is stronger than reporting performance on the same records used to fit a model, but it is still internal validation. Both sets came from the same hospital, years and data system. The paper does not test a later time period, another Chinese hospital or a health system with different case mix and measurement practice. It also does not compare the machine-learning models with established pediatric mortality scores such as PRISM, PIM or PELOD on the same children. Without that comparator, the analysis cannot show that the model adds value to existing bedside assessment.[1]
Why AUC and sensitivity tell different stories
The optimized model’s hold-out AUC was 0.8521, with a reported interval of 0.8414 to 0.8627. AUC asks whether the model tends to rank a randomly selected child who died above one who survived across every possible threshold. It does not specify what happens at the threshold used to trigger an action. After threshold selection, sensitivity was 42%. If that rate carried directly to the 216 deaths in the complete cohort, it would correspond roughly to identifying 91 and missing 125, although the paper reports test performance rather than a cohort-wide alert count. The arithmetic illustrates the tension; it is not a reconstruction of the test confusion matrix.
Methodological guidance in The Lancet Digital Health argues that discrimination should be accompanied by calibration and clinical-utility evidence. Calibration asks whether a stated risk resembles the observed frequency. Clinical utility asks whether acting on predictions improves decisions after the costs of false alarms and missed cases are considered. The PIC study reports AUC, sensitivity, specificity and F1 score, but not a decision-curve analysis or a prospective workflow. Its low sensitivity is especially important because a mortality alert that fails to flag most deaths could create false reassurance.[1][2]
What the explainability analysis did—and did not—show
The researchers used SHAP values to examine which variables influenced seven of the models. Five measures appeared prominently in both the univariate association analysis and the optimized CatBoost explanations: minimum lactate, maximum lactate, mean respiratory rate, maximum hematocrit and minimum urea. Other variables diverged. Phosphate and coagulation measures were strong when assessed one at a time but did not appear among the model’s top SHAP features; pCO₂, creatine kinase, hemoglobin and pH were more prominent in the multivariable model.
That comparison helps diagnose how the database is being used, but SHAP importance is not a causal explanation and does not make a prediction clinically safe. A high SHAP value means a feature contributed to this model’s output for these data. It does not establish that changing the feature would change the outcome, that the measurement was taken consistently, or that the same relationship will hold elsewhere. The partial agreement between methods is informative precisely because it exposes dependence on modeling choices rather than revealing a universal biological rule.[1]
What this means for children, clinicians and database builders
For families, the immediate effect is limited: this was a secondary analysis and no child received an algorithmic warning. For clinicians, it is a reminder that a polished score can conceal a poor operating point. A low-sensitivity alert should not replace examination, monitoring or validated clinical scores. If displayed without its miss rate, it could redirect attention toward children the model recognizes and away from children whose deterioration is represented poorly in the training data.
The more constructive implication is for infrastructure. Pediatric critical-care datasets are scarce, and the PIC database makes research possible where proprietary records would otherwise remain inaccessible. The authors’ audit identifies what a next-generation resource needs: richer physiological and neurological variables, consistent units, less missingness, multicentre participation and clear temporal structure. Dataset quality is not a preliminary housekeeping task; it sets the ceiling on the safety and usefulness of every model built from it.[1]
What evidence would change the assessment
A credible next step would freeze the model and test it prospectively in several pediatric ICUs with different populations, equipment and care practices. Results should include calibration, sensitivity and false-alarm burden at prespecified thresholds, performance for age and diagnostic subgroups, comparison with established scores, missing-data stress tests and independent replication. Researchers should also report whether the model remains useful when clinicians already know the same laboratory results that drive its prediction.
Deployment would require a further step: a controlled study of the alert-and-response pathway. That study would measure whether clinicians act, whether action is appropriate, whether treatment or escalation becomes faster, and whether harms from false positives or missed cases increase. Until those tests are done, the 0.8521 AUC should be read as evidence that one database contains some ranking signal—not as evidence that an AI system can safely predict which critically ill children will survive.[1][2]
Watch the background, then check the evidence
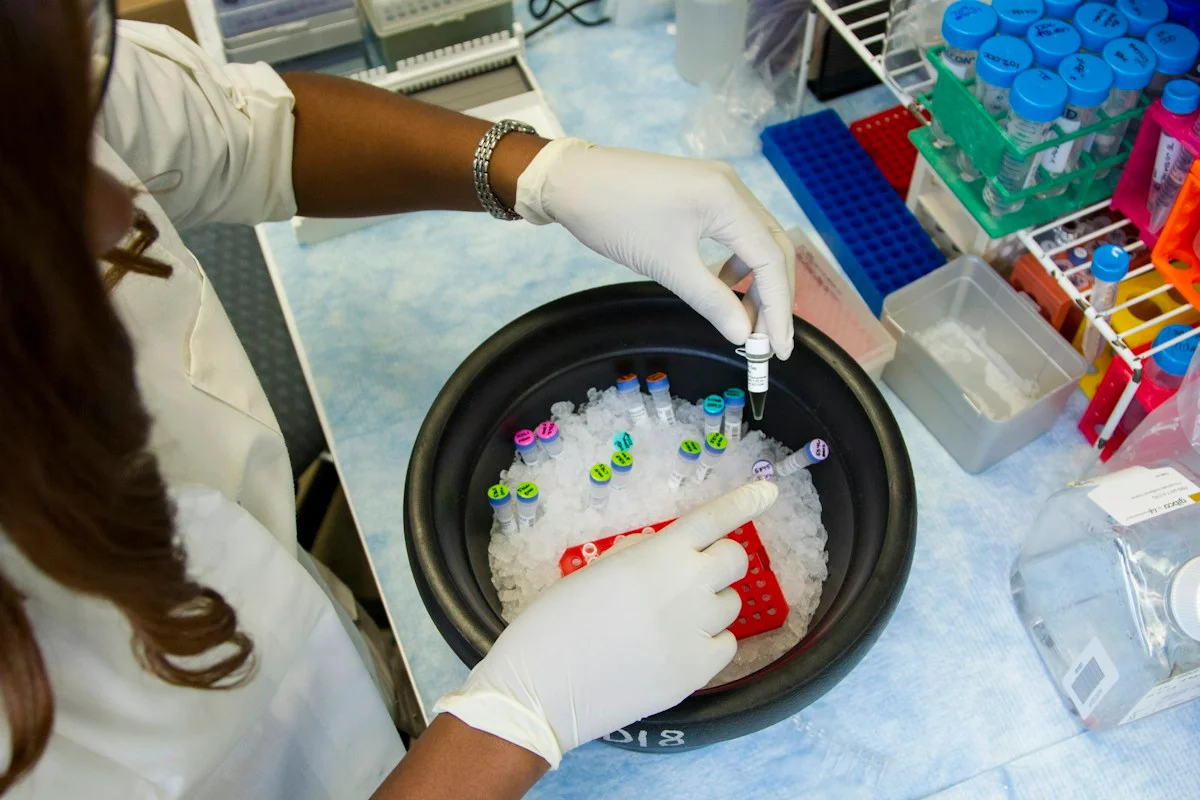
Illustrative photo · not a video frame
The Royal Society · 44 min 28 sec · Background explainer
Is this the AI future we want? | The Royal Society
YouTube loads only when you choose; playback starts when you press play.
A Royal Society discussion with Madhumita Murgia and biomedical engineer Alison Noble on AI’s potential in healthcare, science and culture, recorded at the 30 June 2026 event.
Evidence check: A discussion of opportunities and risks, including future possibilities. It is not evidence that every application described is available or clinically proven.
Published 2026-07-01. Source checked 14 October 2026. Check captions on the publisher’s video page.
Check the healthcare evidencePhoto: Daniel Sone / National Cancer Institute / Unsplash · Licence
Continue the story
Read next
Continue exploring clinical ai: compare the finding and its evidence limits.
A small mental-health model beat larger LLMs on one hospital’s records. Can it travel?
Zhixin reached 68.33% exact-match accuracy on 1,020 held-out Chinese clinical records, compared with 49.88% for the strongest prompted comparator. The test came from the same specialist hospital as training, covered an imbalanced subset of diagnoses and did not measure patient outcomes.
Read the next reportExplore the full source and evidence record
What this means for people
- No child was treated on the basis of this model. The main near-term consequence is how researchers and clinicians interpret a strong AUC beside a low detection rate for deaths.
- Better multicentre pediatric datasets could support safer tools, but an incomplete database risks making children with less typical or less completely recorded illness harder for a model to recognize.
Global context
The data came from one tertiary children’s hospital in China, while the analysis team included researchers in Colombia. Pediatric ICU populations, laboratory practice and resources differ across countries and hospitals. A public dataset is valuable for reproducibility, but a model trained on it cannot be assumed to transfer to lower-resource units, different age distributions or other health systems.
What the evidence does not yet show
- Retrospective analysis of one hospital’s 2010–2018 database, with no external or temporal validation.
- Only 216 deaths were available, and the hold-out test therefore contained a much smaller number of outcome events.
- The usable predictors were dominated by laboratory measures and omitted important physiological and neurological information.
- Missing values were imputed, variables over 60% missing were excluded, and performance may depend on those preprocessing choices.
- No head-to-head comparison with established pediatric risk scores, calibration assessment, decision-curve analysis or prospective clinical evaluation was reported.
What to watch next
- External validation in multiple pediatric ICUs and a later time period
- Calibration, precision-recall and decision-curve results at prespecified thresholds
- Direct comparison with PRISM, PIM and PELOD scores
- Subgroup performance, false-alarm burden and robustness to missing data
- Prospective evidence that an alert changes appropriate care and improves outcomes
Living evidence record
Impact record IAI-174G4F0
Evidence stage
Studied
Confidence
Supported
Reporting basis
Source analysis
Independent or research support
Present
Record status
Monitoring
Last checked
2 November 2026
Source trail
2 direct sources across 1 source type.
People impact
Documented in this record.
Uncertainty
Limits and next checks are explicit.
Stages describe the evidence available—not whether a technology is good or bad. See the public method.
Related-source reporting disclosure
This record analyses 2 linked source records around the same underlying development. The extra records add method, date or context, but they do not by themselves constitute independent replication of every performance claim or predicted outcome.
Evidence trail
Sources used for this report
Links checked 2 November 2026
Research question, topics and regions
Whether the single-hospital PIC database contains enough information to support reliable pediatric ICU mortality prediction
Topics: Pediatric intensive care · Mortality prediction · Dataset quality · Clinical AI · Model evaluation
Regions: China · East Asia · Colombia
This report is labelled source analysis. We summarise and analyse source material in our own words; company statements remain attributed claims until independently supported. Translated summaries preserve the meaning of the original source and link back to it. Read our editorial standards.
Reader commentary
What does this mean where you are?
Tell us what you have seen at work, in your community or in everyday life. A question is welcome too. No account is needed; we review notes before publishing them.
Explore commentary across the portal →Published reader notes
0No published reader notes yet. You can start the evidence-led discussion above.
Prefer a private correction or response? Contact the newsroom.