Why did a pneumonia AI fall from 98% accuracy to 60% on outside data?
A peer-reviewed chest X-ray model scored 98.12% on its internal test set, then 60.42% and 74.30% on two external datasets. The gap is a warning about domain shift—not evidence of a deployable diagnostic tool.
The short version
- What happened
- The model was trained and tested on a balanced public set of 4,800 images; the reported 960-image internal test accuracy was 98.12% (95% confidence interval 97.42%–98.64%).
- Who it affects
- For patients and clinicians, an impressive benchmark score is not enough: a chest X-ray model must work on the scanners, populations and disease mix where care is actually delivered, without hiding confident errors behind an average.
- What remains unproven
- Retrospective public-image benchmark with no clinical workflow or patient outcome test
Keep in mind
Retrospective public-image benchmark with no clinical workflow or patient outcome test
No patient identifiers or demographic metadata for patient-level splitting or subgroup analysis
230 within-class near-duplicate pairs remained in the 4,800-image development set
External repositories combine images from earlier sources and include previously augmented material
Internal inconsistencies in the reported test-set counts and transformer-block description require clarification
Source analysis · 3 linked sources. Primary analysed source date: 26 October 2026. Earliest linked supporting source: 11 June 2020.
Keep following the evidence
Join The Impact Brief founding list for selected AI reports, their effect on people and the evidence limits. Read a sample first.
Read the full report · 4 min The evidence, methods, implications and limitations
The strong internal score did not travel
A peer-reviewed study of automated chest X-ray classification produced two very different pictures of performance. Researchers trained a self-supervised Vision Transformer to classify COVID-19, pneumonia and normal images. On the paper's balanced 4,800-image development set, 3,072 images were assigned to training, 768 to validation and 960 to a held-out test. The reported internal test accuracy was 98.12%, with a 95% confidence interval from 97.42% to 98.64%; five-fold cross-validation averaged 98.27%.
The researchers also checked for obvious image redundancy. They reported no exact duplicates but found 230 near-duplicate pairs, all within the same class. That is useful scrutiny, yet the images carried no patient-level identifiers or demographic metadata. The split was therefore described at image level, and the paper does not establish that every repeated view or image from one patient stayed in only one partition. Near-duplicate images can still make an internal benchmark easier even when they never cross diagnostic classes.[1]
Two outside datasets exposed domain shift
When the same model was applied to two independently assembled public datasets, accuracy fell to 60.42% and 74.30%. The corresponding areas under the ROC curve were 69.13% and 95.49%, showing that ranking ability and final classification accuracy can diverge. The first repository contains 4,575 images balanced across the three classes. The second contains 603 images: 221 COVID-19, 234 normal and 148 pneumonia images. These are image denominators, not unique-patient counts.
The external sets are not pristine multicentre clinical cohorts. Both combine images from earlier repositories, and the larger set says its COVID-19 class includes 912 previously augmented images. Differences in acquisition, compression, labels, class balance and source population can all alter performance. That variability is precisely why external validation matters: a model can learn source-specific cues that look predictive inside one collection but do not hold when images come from somewhere else.[1][2][3]
The distinction that matters
The same model, three image collections
Internal testing suggested near-perfect classification; outside data changed the result substantially.
Development set
4,800 public images; reported 960-image held-out test
98.12% accuracy
External set 1
4,575 images assembled from several repositories
60.42% accuracy
External set 2
603 images across three unequal classes
74.30% accuracy
Clinicians should read the gap, not the 98% headline
This was a retrospective computing experiment, not a clinical trial. No radiologist comparison, diagnostic workflow, treatment decision or patient outcome was measured. The task also grouped COVID-19, other pneumonia and normal images into three labels rather than testing the full range of conditions encountered in practice. The authors therefore describe the model as research-stage and call for geographically diverse, prospective multicentre evaluation.
The publication record needs clarification too. Its methods specify a 960-image test set, while the reported confusion-matrix counts total 1,920 images; one architecture description says four transformer blocks and another says eight. Those inconsistencies do not erase the external-performance gap, but they reduce confidence in the precise internal comparison. A clinically useful assessment would require a frozen model, patient-level sampling, verified labels, prespecified thresholds, calibration, failure reporting and comparison with ordinary radiology practice at each intended site.[1][2][3]
Watch the background, then check the evidence
Illustrative photo · not a video frame
The Royal Society · 44 min 28 sec · Background explainer
Is this the AI future we want? | The Royal Society
YouTube loads only when you choose; playback starts when you press play.
A Royal Society discussion with Madhumita Murgia and biomedical engineer Alison Noble on AI’s potential in healthcare, science and culture, recorded at the 30 June 2026 event.
Evidence check: A discussion of opportunities and risks, including future possibilities. It is not evidence that every application described is available or clinically proven.
Published 2026-07-01. Source checked 14 October 2026. Check captions on the publisher’s video page.
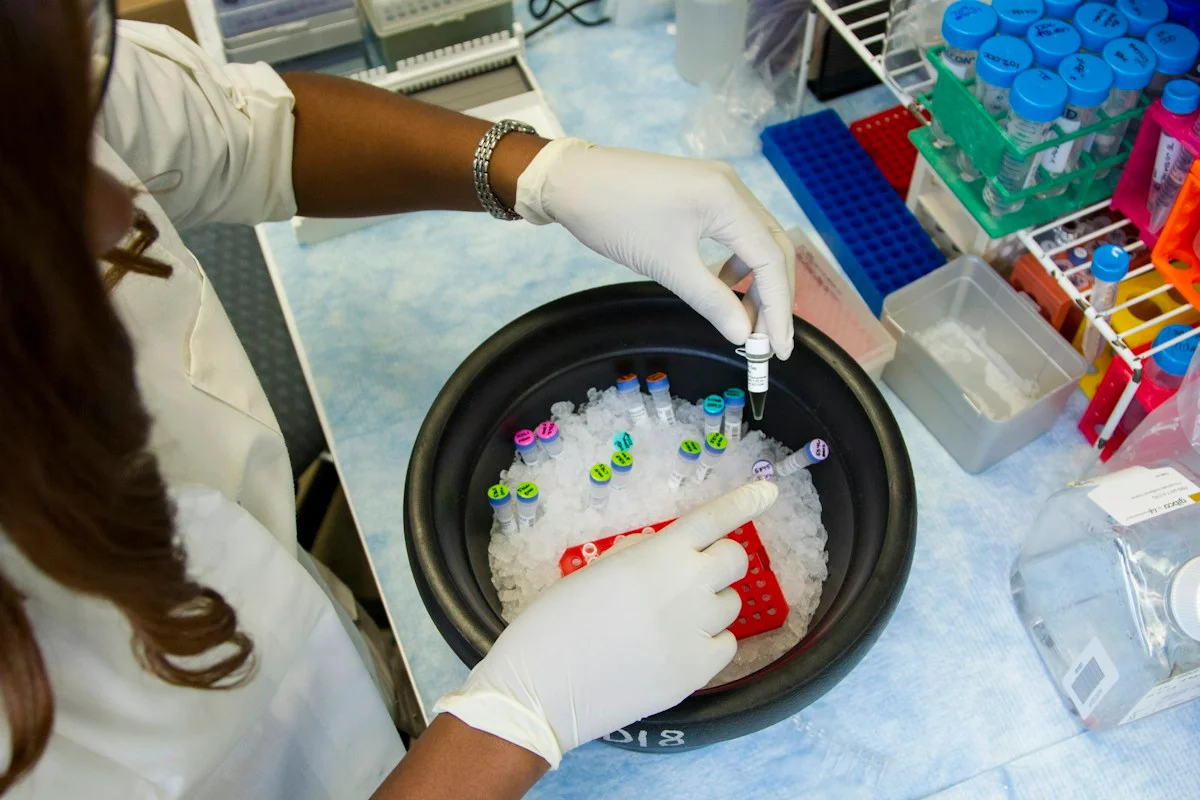
Check the healthcare evidencePhoto: Daniel Sone / National Cancer Institute / Unsplash · Licence
Continue the story
Read next
Continue exploring medical imaging: compare the finding and its evidence limits.
Can endoscopy AI travel beyond still images?
A new classifier reached about 94% accuracy in cross-validation and 96% on an aligned external image subset, then narrowly outscored five gastroenterologists on 200 still images. Both datasets came from Norway, and the work did not test live video, workflow or patient outcomes.
Read the next reportExplore the full source and evidence record
What this means for people
- For patients and clinicians, an impressive benchmark score is not enough: a chest X-ray model must work on the scanners, populations and disease mix where care is actually delivered, without hiding confident errors behind an average.
Global context
The authors work in Bangladesh and Australia, while the public image repositories combine material from several countries and online sources. That breadth does not equal a representative multinational cohort: provenance, imaging practice, prevalence and labels remain heterogeneous and incompletely patient-linked.
What the evidence does not yet show
- Retrospective public-image benchmark with no clinical workflow or patient outcome test
- No patient identifiers or demographic metadata for patient-level splitting or subgroup analysis
- 230 within-class near-duplicate pairs remained in the 4,800-image development set
- External repositories combine images from earlier sources and include previously augmented material
- Internal inconsistencies in the reported test-set counts and transformer-block description require clarification
What to watch next
- Publisher or author clarification of the test denominator and architecture description
- Frozen patient-level validation across hospitals, scanners and demographic groups
- Calibration, class-specific errors and confidence intervals at prespecified thresholds
- Prospective comparison with radiologists and measurement of downstream decisions and outcomes
Living evidence record
Impact record IAI-0CQUSBR
Evidence stage
Studied
Confidence
Corroborated
Reporting basis
Source analysis
Independent or research support
Present
Record status
Monitoring
Last checked
26 October 2026
Source trail
3 direct sources across 2 source types.
People impact
Documented in this record.
Uncertainty
Limits and next checks are explicit.
Stages describe the evidence available—not whether a technology is good or bad. See the public method.
Related-source reporting disclosure
This record analyses 3 linked source records around the same underlying development. The extra records add method, date or context, but they do not by themselves constitute independent replication of every performance claim or predicted outcome.
Evidence trail
Sources used for this report
Links checked 26 October 2026
Research question, topics and regions
Whether a self-supervised Vision Transformer trained on public chest X-rays retained its performance on independently assembled datasets
Topics: Medical imaging · Pneumonia · External validation · Domain shift
Regions: Asia · Oceania · Global
This report is labelled source analysis. We summarise and analyse source material in our own words; company statements remain attributed claims until independently supported. Translated summaries preserve the meaning of the original source and link back to it. Read our editorial standards.
Reader commentary
What does this mean where you are?
Tell us what you have seen at work, in your community or in everyday life. A question is welcome too. No account is needed; we review notes before publishing them.
Explore commentary across the portal →Published reader notes
0No published reader notes yet. You can start the evidence-led discussion above.
Prefer a private correction or response? Contact the newsroom.