Eight vision-language models read charts differently from people—why does that matter?
Across six assessments, models were generally less accurate than people and made different patterns of mistakes. The study is broad and peer reviewed, but its model snapshot dates from 2024.
The short version
3 key points
- What changed
- Researchers tested eight vision-language models on six chart assessments containing 851 items; every model received every item ten times, producing 8,510 responses per model.
- Why it matters
- Workers using AI to interpret dashboards should verify source values and calculations rather than assuming a fluent explanation reflects human-like visual understanding.
- What to watch
- Registered reruns on current multimodal models
A broad comparison with human answers
A peer-reviewed study has found that eight vision-language models not only trailed people on chart questions overall but also made errors unlike the errors people made. The researchers combined six assessments covering basic graph reading, literacy, misleading charts, higher-order reasoning and natural-language chart questions. The suite contained 851 items; each model answered every item ten times, producing 8,510 responses per model.[1][2]
Invalid answers and an old model snapshot matter
Formatting failures changed the picture. One LLaVA model produced valid answers for only 2,735 of 8,510 prompts; MatCha produced 7,082. Counting only valid answers raised reported accuracy, especially on multiple-choice tasks. That distinction matters wherever an automated system must deliver a usable answer, not merely demonstrate latent knowledge.[1][2]
Who it affects
Workers using AI to interpret dashboards should verify source values and calculations rather than assuming a fluent explanation reflects human-like visual understanding.[1][2]
Keep in mind
The evaluated model snapshot is from April–May 2024 and excludes current systems.
Six assessments improve breadth but do not represent every workplace chart, language, accessibility need or decision consequence.
The study measures task performance, not whether model assistance improves or harms real human decisions.
Source analysis · 2 linked sources. Original source date: 19 October 2026.
Read the full report · 3 min The evidence, methods, implications and limitations

A broad comparison with human answers
A peer-reviewed study has found that eight vision-language models not only trailed people on chart questions overall but also made errors unlike the errors people made. The researchers combined six assessments covering basic graph reading, literacy, misleading charts, higher-order reasoning and natural-language chart questions. The suite contained 851 items; each model answered every item ten times, producing 8,510 responses per model.
The human comparison drew on existing assessment samples—1,135 people for two tests, 497 for CALVI, 531 for HOLF and 1,743 for HOLF-Multi—plus 50 recruited participants who each answered 25 ChartQA items. GPT-4V was the best model on five of six assessments when valid responses were compared, but people still led across value identification, arithmetic and statistical inference. No model approached the paper's human noise ceiling for matching human error patterns.[1][2]
Invalid answers and an old model snapshot matter
Formatting failures changed the picture. One LLaVA model produced valid answers for only 2,735 of 8,510 prompts; MatCha produced 7,082. Counting only valid answers raised reported accuracy, especially on multiple-choice tasks. That distinction matters wherever an automated system must deliver a usable answer, not merely demonstrate latent knowledge.
The main limit is time: BLIP2, three LLaVA variants, Pix2Struct, MatCha and GPT-4V were evaluated in April and May 2024. The findings cannot rank current systems. They instead provide a reusable human-centred method. New evidence should rerun the same assessments on current models, pre-register scoring, report accessibility and real-workflow outcomes, and test whether review tools help people catch the distinctive mistakes.[1][2]
The distinction that matters
What the evaluation separates
Accuracy alone does not show whether a model understands a chart like a person.
Accuracy
Score 851 chart questions
Compare model and human correctness
Validity
Count unusable or malformed answers
Avoid flattering valid-only scores
Error pattern
Compare which items are missed
Test whether mistakes resemble human mistakes
Watch the background, then check the evidence
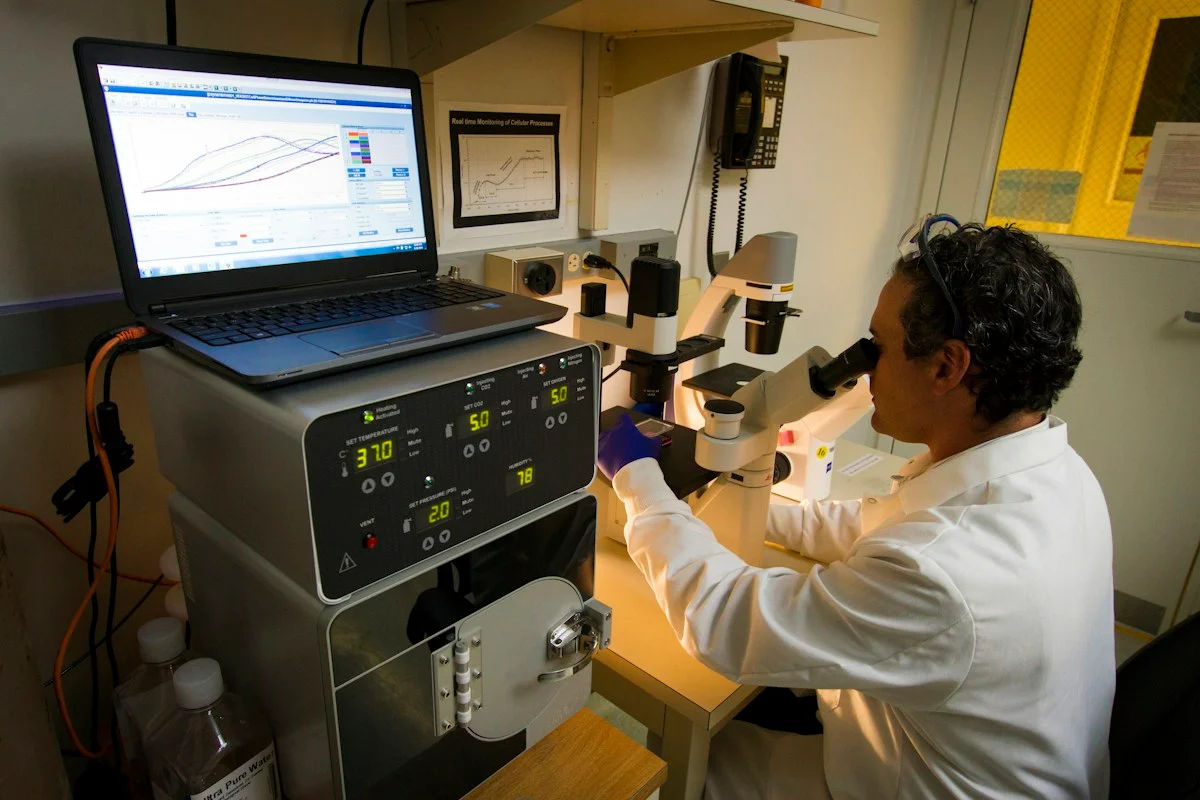
Illustrative photo · not a video frame
Google DeepMind · 1 min 52 sec · Background explainer
Protein folding explained
YouTube loads only when you choose; playback starts when you press play.
A short introduction to why a protein’s shape matters. It provides background for understanding what AI structure prediction contributes to biological research.
Evidence check: This is the developer’s explanation. Predicting a structure does not by itself establish a treatment’s safety or benefit for patients.
Published 2020-11-30. Source checked 14 October 2026. Check captions on the publisher’s video page.
Explore current researchEvidence check
The evaluated model snapshot is from April–May 2024 and excludes current systems.
Six assessments improve breadth but do not represent every workplace chart, language, accessibility need or decision consequence.
The study measures task performance, not whether model assistance improves or harms real human decisions.
Reporting basis: Source analysis. Original source date: 19 October 2026.
Continue the story
Read next
Also about human-computer interaction
What do people actually ask image-upload AI to do?
An unreviewed Microsoft-led study analysed 42,617 de-identified Copilot image-upload sessions and checked its taxonomy against 23,413 ChatGPT sessions. Users often chained recognition into writing, code and data tasks—but private, model-generated summaries limit what outsiders can verify.
Read the 7 min reportAlso about model evaluation
Can a foundation model beat Cox regression on small survival datasets?
SurvICL ranked first across 63 held-out datasets without dataset-specific tuning. The unreviewed benchmark is broad, but it does not test clinical decisions, competing risks or changing patient data.
Read the 4 min reportExplore the full source and evidence record
What this means for people
- Workers using AI to interpret dashboards should verify source values and calculations rather than assuming a fluent explanation reflects human-like visual understanding.
- Designers can use human error patterns and invalid-response rates as separate acceptance tests before deploying chart-reading assistants.
Global context
Charts mediate decisions in health, finance, government and journalism. A model can be useful without thinking like a person, but different failure patterns make independent checks and task-specific validation essential.
What the evidence does not yet show
- The evaluated model snapshot is from April–May 2024 and excludes current systems.
- Six assessments improve breadth but do not represent every workplace chart, language, accessibility need or decision consequence.
- The study measures task performance, not whether model assistance improves or harms real human decisions.
What to watch next
- Registered reruns on current multimodal models
- Workplace studies measuring whether people detect model chart errors
- Results across languages, accessible chart formats and high-stakes decisions
Living evidence record
Impact record IAI-0U17XD4
Evidence stage
Studied
Confidence
Supported
Reporting basis
Source analysis
Independent or research support
Present
Record status
Monitoring
Last checked
20 October 2026
Source trail
2 direct sources across 1 source type.
People impact
Documented in this record.
Uncertainty
Limits and next checks are explicit.
Stages describe the evidence available—not whether a technology is good or bad. See the public method.
Related-source reporting disclosure
This record analyses 2 linked source records around the same underlying development. The extra records add method, date or context, but they do not by themselves constitute independent replication of every performance claim or predicted outcome.
Evidence trail
Sources used for this report
Links checked 20 October 2026
Research question, topics and regions
Whether vision-language models understand charts as accurately as people and whether their errors resemble human errors
Topics: Data visualisation · Vision-language models · Human-computer interaction · Model evaluation
Regions: United States · Global
This report is labelled source analysis. We summarise and analyse source material in our own words; company statements remain attributed claims until independently supported. Translated summaries preserve the meaning of the original source and link back to it. Read our editorial standards.
The Impact Brief · Free
Keep following the stories that matter to you.
Get our weekday briefing on what changed and why it matters. Choose your topics below.
Reader commentary
What does this mean where you are?
Tell us what you have seen at work, in your community or in everyday life. A question is welcome too. No account is needed; we review notes before publishing them.
Explore commentary across the portal →Published reader notes
0No published reader notes yet. You can start the evidence-led discussion above.
Prefer a private correction or response? Contact the newsroom.