Can open radar data train better landslide AI?
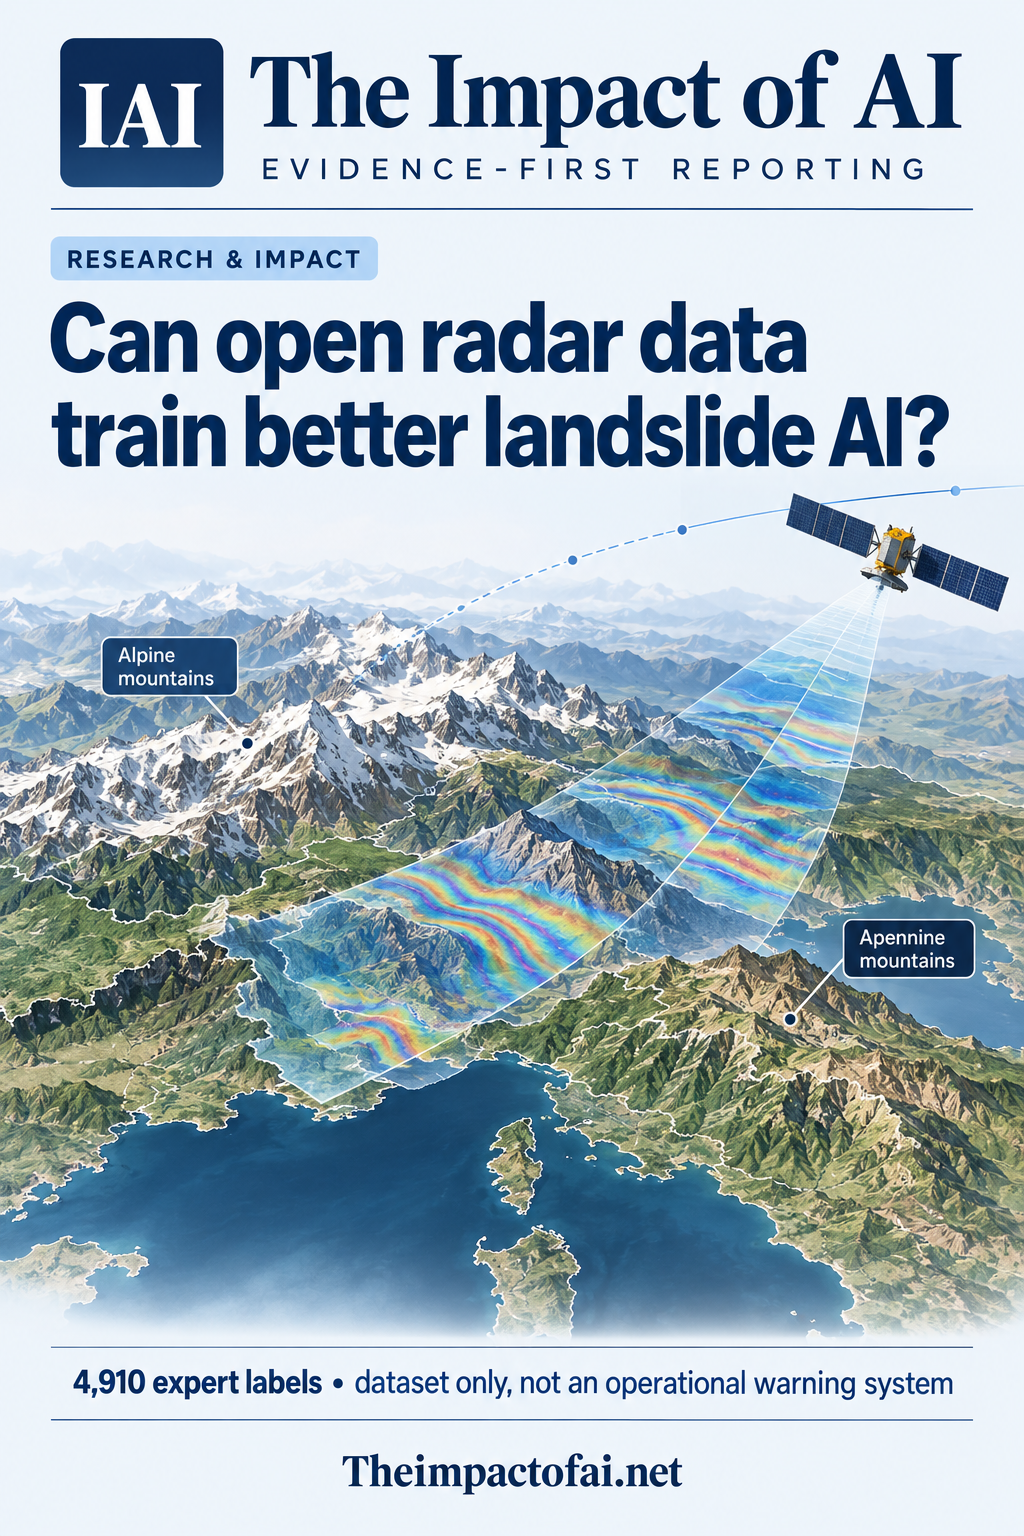
A peer-reviewed data descriptor releases 4,910 expert annotations from 92 selected radar interferograms across the Central Alps and Northern Apennines. It expands material for training slow-movement detectors, but it does not benchmark a model across all nine classes or operate as an early-warning system.
Editorial responsibility: The Impact of AI Editorial Desk · Report a factual concern
At a glance
- 1The MIRAGE release contains 4,910 expert-annotated radar phase signals from 92 selected Sentinel-1 interferograms: 36 for the Central Alps and 56 for the Northern Apennines.
- 2Labels cover nine movement or artefact classes and include wrapped phase imagery, coherence maps and shapefiles; 364 artefact labels are intentionally retained, leaving 4,546 labels for active movements.
- 3The paper describes a dataset rather than a new operational detector. A cited prior YOLOv3 test used only a Northern Apennines subset and cannot establish performance across all classes, regions or warning tasks.
Research topic
An open geomorphology-constrained DInSAR dataset for detecting and classifying slow-moving mass movements
The direct answer: it fills a training-data gap, not an alerting gap
The peer-reviewed release gives researchers a sizeable, openly deposited collection of expert-labelled radar phase patterns associated with slow-moving landslides and periglacial landforms. It is designed for computer-vision training and comparison, where the shortage of reusable annotated interferograms has limited model development. The package combines 4,910 labels with the wrapped radar images, coherence information and geographic label files needed to reproduce a learning task.
It does not show that a new model can detect a dangerous movement in time to warn a community. The article is a Data Descriptor: its central contribution is curation, documentation and technical checking. No single algorithm is trained and validated across the full nine-class dataset in the paper. The appropriate headline is therefore that researchers now have a better-defined test bed, not that AI has solved landslide prediction or monitoring.[1][2]
The Impact Brief · Free
Follow the evidence in climate & energy.
Get a five-minute weekday briefing on what changed, why it matters and where the evidence comes from. Choose the topics you care about.
Ninety-two selected interferograms produced 4,910 labels
The authors processed Sentinel-1 radar imagery from two contrasting areas: the Central European Alps and the Northern Apennines. The underlying processing generated many candidate interferograms across ascending and descending orbits, but the released labelled set contains 92 selected examples—36 from the Alps and 56 from the Apennines. Temporal baselines range from six days to one year. The data products use 15-metre pixels and include phase and coherence rasters plus shapefile annotations.
Experts marked 2,667 signals in the Central Alps and 2,243 in the Northern Apennines. The Alps include deep-seated gravitational slope deformation, debris slides, protalus ramparts, rock glaciers, rockslides and talus. The Apennine labels cover earthflows and earthslides in clay-shales and rockslides in flysch rocks. Artefacts are retained as a negative class because atmospheric or ionospheric patterns can resemble real displacement. Removing 364 artefact labels leaves 4,546 annotations of active movements.[1][2]
The geography creates useful diversity—and severe imbalance
The two regions expose a detector to different terrain, lithology, vegetation, snow conditions and motion geometry. In the Alps, rock glaciers dominate with 1,757 labels, or 65.9% of that regional total. In the Northern Apennines, earthflows in clay-shales dominate with 1,132 labels, or 50.5%. Orbit direction is also uneven: descending tracks predominate in the Alps, while ascending tracks predominate in the Apennines.
Those distributions are scientifically authentic, but an unbalanced training set can produce an apparently accurate model that mostly recognises the largest class or a regional shortcut. Repeated labels may also describe the same movement in different interferograms, so random image splits could leak site identity between training and test data. A credible benchmark should partition by event, slope or geographic area, publish per-class recall and calibration, and test a completely held-out region rather than relying on a pooled random split.[1]
How the labels were checked
The workflow constrains candidate phase patterns with geomorphological evidence instead of treating every colourful radar fringe as movement. The researchers compare labelled areas with optical imagery, mapped landforms, slope and a terrain-roughness index. They also record confidence attributes for signal quality and class assignment. Selected interferograms had average coherence above 0.45 and relatively few pixels below 0.2, an attempt to avoid examples dominated by noise.
Technical validation is not the same as independent double annotation. The paper documents expert-guided selection and checks whether mapped patterns are consistent with terrain and expected movement geometry, but it does not report a blinded multi-rater agreement statistic for all 4,910 labels. Boundaries are boxes or polygons around radar signals whose visible extent may not coincide with the full geomorphological feature. That makes the labels practical for object detection while leaving uncertainty about exact footprint and class in ambiguous cases.[1]
The cited model result is narrower than the dataset
In its usage notes, the paper cites an earlier YOLOv3 object-detector experiment on a Northern Apennines subset. That work used an 80% training, 10% validation and 10% testing split and reported mean average precision of 0.88 and an F1 score of 0.75. It is evidence that radar phase labels can support a detection task, but it is not a benchmark of the full release and does not cover every Alpine class or a new geographic region.
The distinction matters for people living near unstable slopes. Object detection in a prepared image is only one part of a warning chain. An operational service must acquire data quickly enough, handle decorrelation and atmospheric artefacts, confirm change across passes, estimate urgency, combine rainfall and ground observations, communicate uncertainty and assign responsibility for action. Sentinel-1 revisit intervals and the slow-moving focus of MIRAGE make the dataset more suitable for research and monitoring support than immediate emergency alerts.[1]
What the open release could enable—and what would change the assessment
Because the images and labels are openly deposited, independent teams can test architectures, class-balancing methods, event-level splits and domain adaptation without first rebuilding the annotation pipeline. Researchers can also ask whether coherence, orbit and temporal baseline help a model distinguish artefacts from real movement. The paper reports European Union NextGenerationEU and Italian Ministry of University and Research support and no competing interests. It also states that ChatGPT assisted English editing, not data generation or analysis.
Confidence in practical value would rise with a public benchmark protocol that locks region-held-out test sets, prevents repeat observations of the same movement crossing splits and reports every class rather than a pooled score. The decisive next step is prospective testing on newly acquired interferograms outside the two study areas, followed by comparison with expert workflows and ground truth. Only then could researchers assess missed movements, false alarms, review time and whether the system improves decisions rather than simply drawing boxes on known signals.[1][2]
What this means for people
- The dataset may reduce the cost of building research detectors, but it does not provide residents with a live warning.
- False alarms and missed movements both carry consequences, so expert review remains necessary.
- Open data make independent scrutiny and regional adaptation easier than a closed model alone.
Global context
The labelled examples come from the Central Alps and Northern Apennines, where slope processes, vegetation, snow and radar geometry differ from tropical mountains, arid terrain and rapidly moving failures. Sentinel coverage is global, but a detector trained here would need event-separated testing, local calibration and field validation before use in another region. Open access helps that work; it does not substitute for it.
What the evidence does not yet show
- The journal article is new, but the underlying open dataset was first deposited in 2025.
- Two European study areas cannot establish geographic transfer to other climates, landforms, sensors or monitoring systems.
- Natural class imbalance is substantial, and repeated observations may describe the same movement.
- The paper does not report a blinded multi-rater agreement statistic for all labels.
- No new model is benchmarked across every class, and object detection is not an operational warning service.
What to watch next
- A fixed event- and region-held-out benchmark protocol.
- Per-class results with calibration and false-alarm burden.
- Independent reannotation and agreement measures.
- Prospective tests on new interferograms outside Italy and the Alps.
- Integration with rainfall, ground sensors and accountable human warning workflows.
Living evidence record
Impact record IAI-0JHZ2DD
Evidence stage
Studied
Confidence
Supported
Reporting basis
Source analysis
Independent or research support
Present
Record status
Monitoring
Last checked
9 October 2026
Source trail
2 direct sources across 2 source types.
People impact
Documented in this record.
Uncertainty
Limits and next checks are explicit.
Stages describe the evidence available—not whether a technology is good or bad. See the public method.
Related-source reporting disclosure
This record analyses 2 linked source records around the same underlying development. The extra records add method, date or context, but they do not by themselves constitute independent replication of every performance claim or predicted outcome.
Evidence trail
Sources used for this report
Links checked 9 October 2026
This report is labelled source analysis. We summarise and analyse source material in our own words; company statements remain attributed claims until independently supported. Translated summaries preserve the meaning of the original source and link back to it. Read our editorial standards.
Continue the story
Related reporting
Climate & Energy
Can AI forecast Egypt’s groundwater decline?
A peer-reviewed study combines 21 years of satellite water-storage estimates with land-use mapping and XGBoost for Wadi El-Assiuti. The held-out fit is strong, but the study area is smaller than one GRACE cell and the 2030 path assumes recent conditions continue.
9 min · 1 source
Climate & Energy
Can satellite AI show where a town stays cooler?
A peer-reviewed Algeria case study compared four machine-learning methods on seven Landsat 9 scenes. The maps may help frame local heat questions, but the apparent accuracy comes from only 30 held-out proxy points—not field temperatures, human exposure or health outcomes.
10 min · 2 sources
Climate & Energy
Can satellite AI travel across regions?
A peer-reviewed Egyptian benchmark found that five change-detection models lost accuracy when moved between Chinese and French remote-sensing datasets. Aligning feature statistics and adding ten labelled target examples recovered part of the gap, but the study covers three public benchmarks—not live disaster or climate operations.
7 min · 3 sources
Reader commentary
Add evidence, experience or a question
No account is required. Reader notes are published after a brief civility, relevance and safety check; disagreement is welcome.
Explore commentary across the portal →Published reader notes
0No published reader notes yet. You can start the evidence-led discussion above.
Prefer a private correction or response? Contact the newsroom.